empty
25.06.2019 02:22 AM
EUR / USD h4 vs USD / JPY h4 vs EUR / JPY. Comprehensive analysis of movement options from June 25, 2019. Analysis of APLs & ZUP

A comprehensive analysis of movement options of the European and Japanese currency + cross-instrument of these -> EUR / USD vs USD / JPY vs EUR / JPY from June 25, 2019.
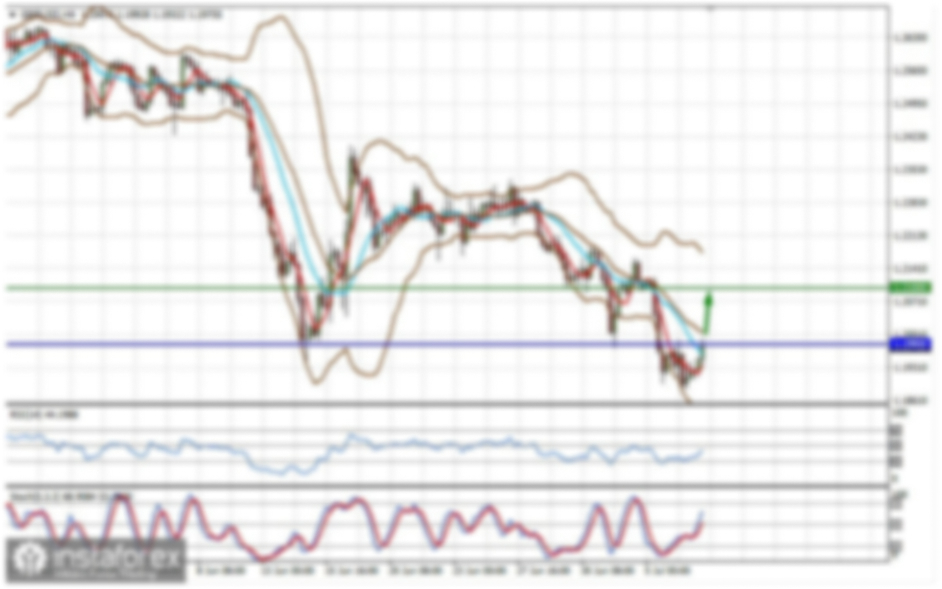
____________________

Euro vs US Dollar

Testing and the direction of the breakdown of coincident boundaries (1.1355 <-> 1.1390 <-> 1.1420) equilibrium zone of Minuette operating scale fork will determine the further development of the movement of the single European currency EUR / USD on June 25 2019. Details of working out the boundaries of these zones of equilibrium can be seen on the animated graphics.

The breakdown of the support level of 1.1355 (intersection of ISL38.2 Minuette and ISL38.2 Minuette) -> development of the downward movement of EUR / USD can be continued to the boundaries of the 1/2 Median Line channel Minuette (1.1330 <-> 1.1305 <-> 1.1285) with the prospect of reaching the support level of 1.1260 at the intersection of the initial SSL lines of the Minuette operational scale fork.

The breakdown of the resistance level of 1.1.1420 (intersection of ISL61.8 Minuette and ISL61.8 Minuette) -> the option of continuing the development of the upward movement of the single European currency to the final FSL (1.1525) line of the Minuette operational scale fork.

The markup of the EUR / USD movement options is shown in the animated graphics.

This image is no longer relevant

____________________

US Dollar vs Japanese Yen

The movement of the USD / JPY on June 25, 2019 is due to perfecting the boundaries channel of the 1/2 Median Line (107.40 <-> 107.55 <-> 107.70) Minuette operational scale fork. More details of the movement inside this channel are shown on the animated graphics.

The breakdown of the level of resistance 107.70 (the upper boundary of the channel of the 1/2 Median Line Minuette) together with ISL38.2 Minuette (107.80) -> development of the movement USD / JPY continues to equilibrium zone (107.80 <-> 108.00 <-> 108.25) Minuette operational scale fork, and in case of a breakdown of ISL61.8 Minuette (108.25), the upward movement of this currency instrument can be continued to the boundaries of the 1/2 Median Line channel (108.65 <-> 109.05 <-> 109.45) of the Minuette operational scale fork.

The breakdown of the support level of 107.40 (lower boundary of the channel of the 1/2 Median Line Minuette) and the control line LTL (107.33) of the Minuette operational scale fork -> development of the USD / JPY movement can continue to the goals -> initial line SSL Minuette (107.10) <-> local minimum (107.05) <-> control line LTL Minuette (106.95) <-> warning line LWL38.2 (106.45) Minuette operating scale fork.

Markup options for the USD / JPY movement are indicated in the animated graphic ->

This image is no longer relevant

____________________

Euro vs Japanese Yen

From June 25, 2019, the cross-instrument EUR / JPY will develop its movement in accordance with the working out and direction of the breakdown of the boundaries of the 1/2 Median Line channel (121.80 <-> 122.10 <-> 1.2240) of the Minuette operating scale fork.

The breakdown of the lower boundary of the channel of the 1/2 Median Line Minuette (support level of 121.80) -> the downward movement of the cross instrument can be continued to the goals -> SSL start line (121.20) of the Minuette <-> minimum (120.93 <-> 120.76).

On the other hand, the breakdown of the upper boundary of the channel of the 1/2 Median Line Minuette (resistance level of 122.40) will confirm that further development of the cross-instrument movement will continue in the equilibrium zone (122.30 <-> 122.70 <-> 123.14) of the Minuette operating scale fork, and later , the breakdown of ISL61.8 Minuette (123.14) and ISL38.2 Minuette (123.20) will be the actual development of the EUR / JPY movement within the equilibrium zone (123.20 <-> 123.95 <-> 124.65) of the Minuette operational scale fork.

Marking options for the movement of the cross-instrument EUR / JPY is presented in the animated graphic ->

This image is no longer relevant

____________________

The review was compiled without taking into account of the news background. The opening of the trading session of the main financial centers does not serve as a guide to action (placing orders "sell" or "buy").

Ratu Taslim,
الخبير التحليلي لدى شركة إنستافوركس
© 2007-2025
حدد الإطار الزمني
5
د
15
د
30
د
1
س
4
ساعات
1
يوم
1
أسبوع
كسب عائد من تغيرات أسعار العملات المشفرة مع إنستافوركس.
قم بتحميل منصة التداول ميتاتريدر 4 وافتح أول صفقة.
  • Grand Choice
    Contest by
    InstaForex
    InstaForex always strives to help you
    fulfill your biggest dreams.
    انضم إلى المسابقة

المقالات الموصى بها

إشارات التداول لعملة البيتكوين للفترة من 15 إلى 19 مايو 2025: البيع تحت مستوى 103,600 دولار (+1/8 Murray - 21 SMA)

إذا فشل البيتكوين في تجاوز مستوى 103,700، فمن المتوقع حدوث تصحيح تقني إضافي. وبالتالي، قد يصل السعر إلى المستوى النفسي البالغ 100,000 دولار، بل وقد يصل إلى قاع قناة الاتجاه

Dimitrios Zappas 16:51 2025-05-15 UTC+2

إشارات التداول للذهب للفترة من 15 إلى 19 مايو 2025: الشراء فوق 3,222 دولار أو البيع تحت 3,203 دولار (200 EMA - 5/8 Murray)

في بداية الجلسة الأمريكية، يتم تداول الذهب حول مستوى 3,195، تحت خط 5/8 موراي وتحت المتوسط المتحرك الأسي 200 والمتوسط المتحرك البسيط 21، مع انحياز صعودي قوي. خلال الجلسة الأوروبية،

Dimitrios Zappas 16:50 2025-05-15 UTC+2

توقعات الفوركس 15/05/2025: اليورو/الدولار الأمريكي، الجنيه الإسترليني/الدولار الأمريكي، النفط والبيتكوين

روابط مفيدة: مقالاتي الأخرى متوفرة في هذا القسم دورة InstaForex للمبتدئين التحليلات الشائعة افتح حساب تداول مهم: يجب على المبتدئين في تداول الفوركس أن يكونوا حذرين للغاية عند اتخاذ قرارات

Sebastian Seliga 11:22 2025-05-15 UTC+2

التوقعات لليورو/الدولار الأمريكي في 15 مايو 2025

يوم الأربعاء، ارتفع زوج اليورو/الدولار الأمريكي نحو منطقة المقاومة 1.1265–1.1282، وارتد منها، وانعكس لصالح الدولار الأمريكي، الذي تمكن من كسب حوالي 80 نقطة بنهاية اليوم. في هذه المرحلة، يعتبر

Samir Klishi 11:00 2025-05-15 UTC+2

التوقعات لزوج الجنيه الإسترليني/الدولار الأمريكي في 15 مايو 2025

على الرسم البياني الساعي، ارتفع زوج الجنيه الإسترليني/الدولار الأمريكي إلى منطقة المقاومة بين 1.3344 و1.3357 يوم الأربعاء، وارتد منها وبدأ في التحرك نحو الانخفاض باتجاه مستوى فيبوناتشي 100.0% عند 1.3205

Samir Klishi 10:56 2025-05-15 UTC+2

التحليل الفني لحركة السعر اليومية لأزواج العملات الغريبة USD/IDR، الخميس 15 مايو 2025

من خلال ما يظهر على الرسم البياني اليومي، يبدو أن زوج العملات الغريب USD/IDR لديه نمط هبوطي 123 يتبعه ظهور 2 من نمط Bearish Ross Hook (RH) مما يعطي إشارة

Arief Makmur 06:46 2025-05-15 UTC+2

التحليل الفني لحركة السعر اللحظية لمؤشر ناسداك 100، الخميس 15 مايو 2025

إذا نظرنا إلى الرسم البياني لمدة 4 ساعات لمؤشر Nasdaq 100 الذي يتحرك فوق WMA (21) والذي يميل إلى الأعلى، فإن ذلك يشير إلى أن المشترين لا يزالون مهيمنين

Arief Makmur 06:46 2025-05-15 UTC+2

توقعات EUR/USD ليوم 15 مايو 2025

يوم الأربعاء، تمكن اليورو من الارتفاع إلى المستوى المستهدف 1.1266 (القيعان من 15 أبريل و1 مايو)، ولكن في غياب الدعم الخارجي (ارتفع مؤشر S&P 500 بنسبة 0.10%، بينما انخفض مؤشر

Laurie Bailey 04:40 2025-05-15 UTC+2

توقعات GBP/USD ليوم 15 مايو 2025

يواجه الجنيه الإسترليني صعوبة في تجاوز مستوى المقاومة 1.3311 مع إغلاق شمعة يومية. في السياق الحالي، يتماشى هذا المستوى مع الخط الصفري (المحايد) لمذبذب Marlin اليومي. من المثير للاهتمام

Laurie Bailey 04:40 2025-05-15 UTC+2

توقعات USD/JPY ليوم 15 مايو 2025

بحلول نهاية جلسة التداول يوم أمس، انخفض زوج الدولار الأمريكي/الين الياباني بمقدار 73 نقطة، مختبراً خط مؤشر MACD بظل سفلي. من الواضح أنه تم محاولة التماسك ضمن النطاق 145.08–145.91،

Laurie Bailey 04:40 2025-05-15 UTC+2
لا تستطيع التحدث الآن؟
اطرح سؤالك في الدردشة.
Widget callback
 

Dear visitor,

Your IP address shows that you are currently located in the USA. If you are a resident of the United States, you are prohibited from using the services of InstaFintech Group including online trading, online transfers, deposit/withdrawal of funds, etc.

If you think you are seeing this message by mistake and your location is not the US, kindly proceed to the website. Otherwise, you must leave the website in order to comply with government restrictions.

Why does your IP address show your location as the USA?

  • - you are using a VPN provided by a hosting company based in the United States;
  • - your IP does not have proper WHOIS records;
  • - an error occurred in the WHOIS geolocation database.

Please confirm whether you are a US resident or not by clicking the relevant button below. If you choose the wrong option, being a US resident, you will not be able to open an account with InstaForex anyway.

We are sorry for any inconvenience caused by this message.