empty
04.02.2025 07:46 AM
#NDX – Technical Analysis Overview

This image is no longer relevant

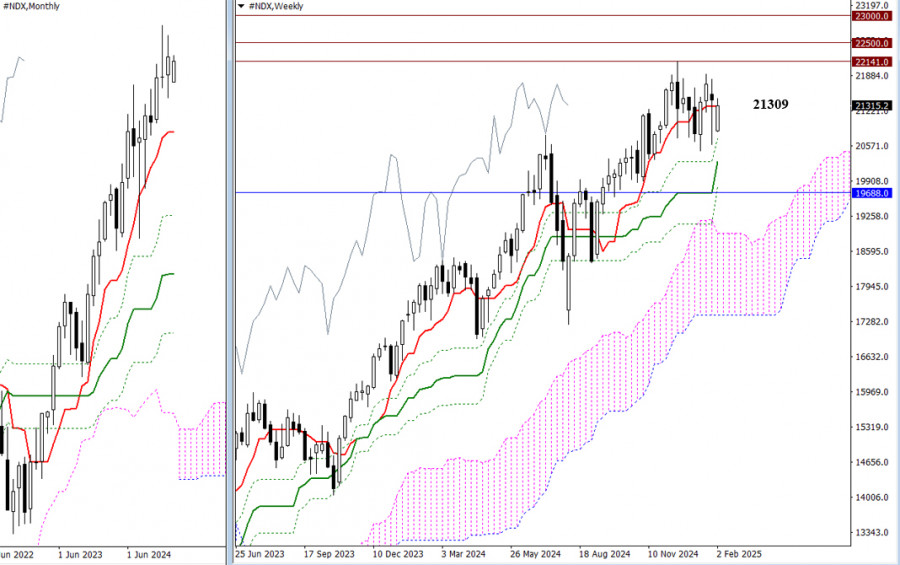
At the end of last year, the index reached a new all-time high of 22,141. Following that peak, the upward momentum stalled, leading to a correction and consolidation phase. Currently, the key focus is the weekly short-term trend level at 21,309. Even yesterday, despite a significant downward gap, prices managed to rebound back to the 21,309 area. Given the current conditions, we can identify the nearest benchmarks for potential market movement. If bullish activity continues, a breakout above the all-time high of 22,141 could pave the way for further gains, targeting the psychological levels of 22,500 and 23,000. On the other hand, if the consolidation phase ends with bearish momentum, the primary targets would involve breaking the Ichimoku weekly cross and a corrective decline towards the monthly short-term trend level at 19,688.

This image is no longer relevant

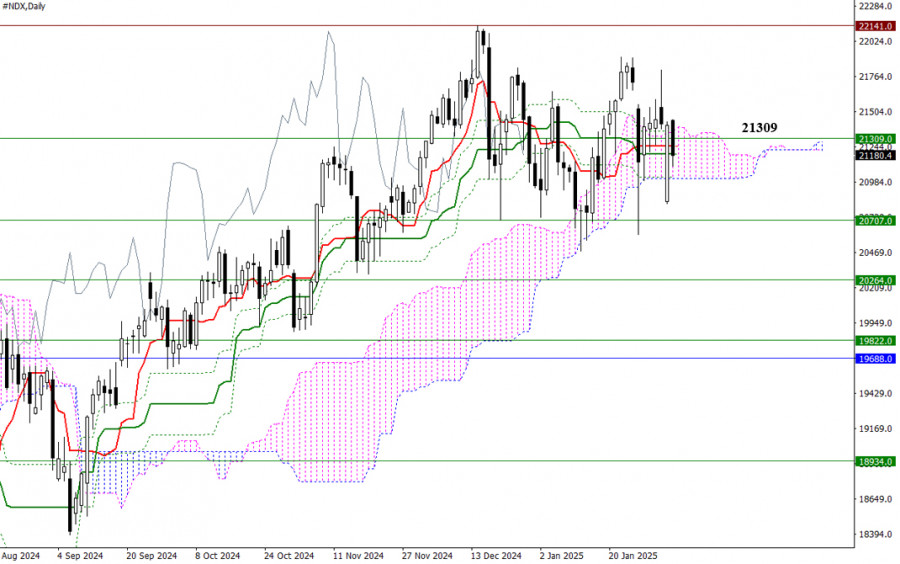
For two consecutive weeks, the market has opened with a significant downward gap, followed by rapid attempts to recover and close that gap. A clear struggle is occurring: one side is trying to push the index much lower, while the other side is working hard to maintain current levels. At present, the bulls have a clear path toward the all-time high of 22,141. The daily Ichimoku setup supports this scenario, featuring a daily cross and daily cloud, along with additional support from the weekly short-term trend at 21,309. If the market breaks below the daily cloud at 21,014, it would trigger a bearish target with further declines potentially reaching the monthly short-term trend at 19,688. Additional support along this trajectory may come from weekly levels at 20,707, 20,264, and 19,822.

This image is no longer relevant

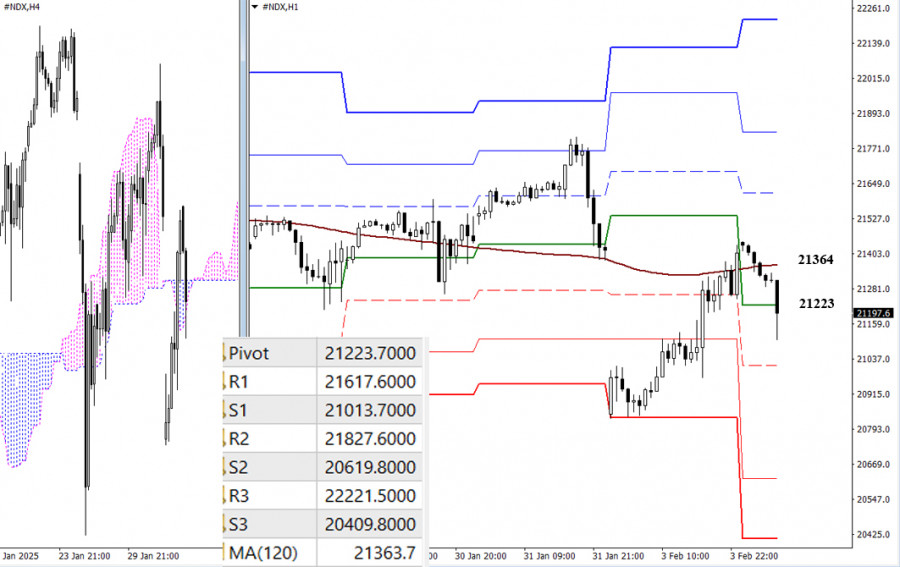
On lower timeframes, the bulls have managed to push the price back to the area of the weekly long-term trend, which is currently positioned at 21,364. The slope and position of this trend contribute to the prevailing uncertainty in the market. We may continue to see consolidation; however, if there are attempts to establish a directional move during the day, classic Pivot levels will serve as key reference points. For the bears, it will be crucial to break through support levels at 21,014, 20,620, and 20,410. Meanwhile, the bulls will be targeting resistance levels at 21,618, 21,828, and 22,222.

***

Technical Analysis Components:
  • Higher Timeframes: Ichimoku Kinko Hyo (9.26.52) and Fibonacci Kijun levels
  • H1: Classic Pivot Points and 120-period Moving Average (weekly long-term trend)
Evangelos Poulakis,
Analytical expert of InstaForex
© 2007-2025
Select timeframe
5
min
15
min
30
min
1
hour
4
hours
1
day
1
week
Earn on cryptocurrency rate changes with InstaForex
Download MetaTrader 4 and open your first trade
  • Grand Choice
    Contest by
    InstaForex
    InstaForex always strives to help you
    fulfill your biggest dreams.
    JOIN CONTEST

Recommended Stories

EUR/USD – June 26th. Powell's Rhetoric Remains Unchanged

On Wednesday, the EUR/USD pair continued to rise and reached the 127.2% Fibonacci corrective level at 1.1712 on Thursday morning. A rebound from this level could lead to a reversal

Samir Klishi 11:17 2025-06-26 UTC+2

GBP/USD. June 26th. Will the U.S. GDP Report Change Anything?

On the hourly chart, the GBP/USD pair on Wednesday secured a position above the resistance zone of 1.3611–1.3633 and continued its upward movement toward the next Fibonacci level of 200.0%

Samir Klishi 10:48 2025-06-26 UTC+2

GOLD. Why Is Gold Rising Again?

The yellow metal is once again receiving support driven by two main factors. The first is the continued risk of failure in the negotiations between Tehran and Tel Aviv

Pati Gani 09:21 2025-06-26 UTC+2

USD/CAD continues to weaken even though there is a potential for a re-test at its Dynamic Resistance, Thursday, June 26, 2025.

USD/CAD – Thursday, June 26 2025. USD/CAD is moving in a weakening condition even though there is a potential for strengthening to the extent of a retracement. Key Levels

Arief Makmur 05:11 2025-06-26 UTC+2

EUR/GBP has the potential to test the Resistance level. 1 before returning to its initial bias, Thursday, June 26, 2025.

EUR/GBP – Thursday, June 26 2025. EUR/GBP is currently moving in a weakening condition but there is potential for a strengthening correction. Key Levels 1. Resistance. 2 : 0.85538

Arief Makmur 05:11 2025-06-26 UTC+2

EUR/USD Forecast for June 26, 2025

EUR/USD Yesterday's data on new home sales in the U.S. for May turned out worse than expected — 623,000 units were sold versus a forecast of 694,000, and the April

Laurie Bailey 05:11 2025-06-26 UTC+2

GBP/USD Forecast for June 26, 2025

GBP/USD With the British pound's active rise this morning, the price consolidation above 1.3635 on the daily chart can be considered confirmed. This opens the path to targets at 1.3834

Laurie Bailey 04:57 2025-06-26 UTC+2

EUR/NZD Forecast for June 26, 2025

EUR/NZD On the weekly chart, the signal line of the Marlin oscillator has turned upward from the border of the bearish territory. The last time a similar pattern occurred (a

Laurie Bailey 04:57 2025-06-26 UTC+2

Trading Signals for EUR/USD for June 25-28, 2025: sell below 1.1645 (21 SMA - 7/8 Murray)

Early in the American session, the EUR/USD pair is trading around 1.1623 within the uptrend channel formed since June 10th and showing a slight recovery after consolidating in this area

Dimitrios Zappas 18:35 2025-06-25 UTC+2

Forecast for EUR/USD on June 25, 2025

On Tuesday, the EUR/USD pair continued its upward movement and nearly reached the 1.1645 level. A rebound from this level would favor the US dollar and lead to a decline

Samir Klishi 12:49 2025-06-25 UTC+2
Can't speak right now?
Ask your question in the chat.
Widget callback
 

Dear visitor,

Your IP address shows that you are currently located in the USA. If you are a resident of the United States, you are prohibited from using the services of InstaFintech Group including online trading, online transfers, deposit/withdrawal of funds, etc.

If you think you are seeing this message by mistake and your location is not the US, kindly proceed to the website. Otherwise, you must leave the website in order to comply with government restrictions.

Why does your IP address show your location as the USA?

  • - you are using a VPN provided by a hosting company based in the United States;
  • - your IP does not have proper WHOIS records;
  • - an error occurred in the WHOIS geolocation database.

Please confirm whether you are a US resident or not by clicking the relevant button below. If you choose the wrong option, being a US resident, you will not be able to open an account with InstaForex anyway.

We are sorry for any inconvenience caused by this message.