empty
10.04.2025 09:56 AM
USD/JPY: Slowing Inflation in the U.S. Could Pressure the Pair

The Japanese yen fell significantly the day before on unexpected news of a 90-day pause in trade wars. This development supported the dollar, but whether its growth will continue remains uncertain. Today's U.S. consumer inflation data is expected to show a slowdown for March. If confirmed, the pair could decline sharply, as this would strengthen expectations that the Federal Reserve will cut interest rates at least once this year. At the same time, the Bank of Japan is leaning toward raising rates. This suggests a growing divergence in interest rate policies.

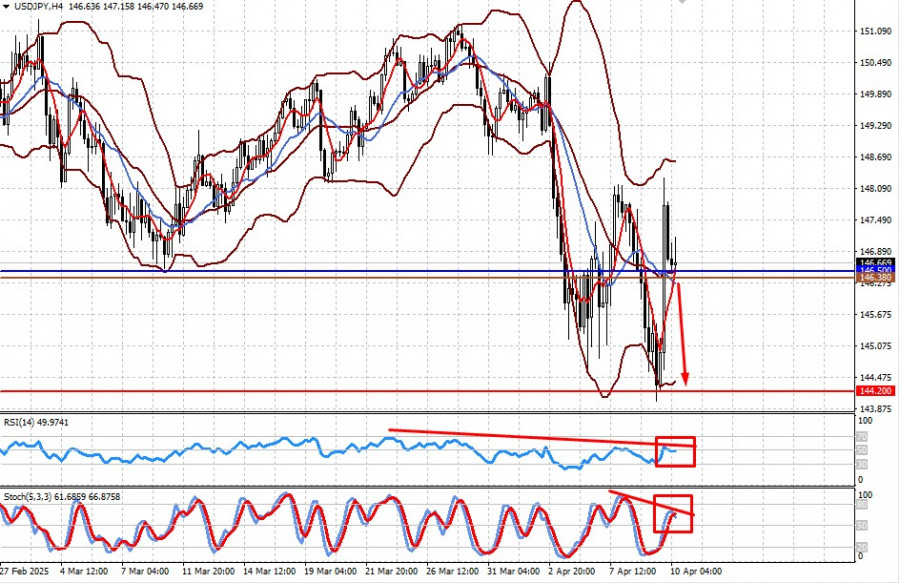
From a technical standpoint, the pair trades within a wide range of 144.20–148.00. Given today's U.S. news, it may drop toward the lower boundary of this range.

Technical Outlook and Trade Idea:

This image is no longer relevant

  • The price is above the middle line of the Bollinger Bands and well above both the SMA 5 and SMA 14.
  • RSI is just below the 50% mark.
  • Stochastic is above 50% but is turning downward, indicating a potential bearish crossover.

I believe the pair may decline toward 144.20. A potential entry point is at 146.38.

Pati Gani,
Analytical expert of InstaForex
© 2007-2025
Select timeframe
5
min
15
min
30
min
1
hour
4
hours
1
day
1
week
Earn on cryptocurrency rate changes with InstaForex
Download MetaTrader 4 and open your first trade
  • Grand Choice
    Contest by
    InstaForex
    InstaForex always strives to help you
    fulfill your biggest dreams.
    JOIN CONTEST

Recommended Stories

USD/JPY. Analysis and Forecast. Current Market Situation

From a technical perspective, as bulls have overcome the barrier of the 100-day Simple Moving Average (SMA) around the 146.80 level, they remain in control. Buying beyond the psychological level

Irina Yanina 17:53 2025-06-23 UTC+2

Trading Signals for EUR/USD for June 23-28, 2025: buy above 1.1460 (21 SMA - 6/8 Murray)

On the contrary, this area around the 21SMA, located at the psychological level of 1.15, is key. Below this area, we could expect a sharp breakout of the uptrend channel

Dimitrios Zappas 16:34 2025-06-23 UTC+2

Trading Signals for GOLD (XAU/USD) for June 23-28, 2025: buy above $3,350 (21 SMA - 7/8 Murray)

If gold continues its recovery and settles above the 21 SMA at 3,364, this could be seen as a buying opportunity with targets at 8/8 Murray at 3,437. The metal

Dimitrios Zappas 16:23 2025-06-23 UTC+2

Forex forecast 23/06/2025: EUR/USD, GBP/USD, USDX, Oil, Ethereum and Bitcoin

Useful links: My other articles are available in this section InstaForex course for beginners Popular Analytics Open trading account Important: The begginers in forex trading need to be very careful

Sebastian Seliga 12:08 2025-06-23 UTC+2

Technical Analysis for the Week of June 23–28: GBP/USD Currency Pair

Last week, the pair moved downward and tested the 14.6% pullback level at 1.3392 (red dashed line), after which the price rebounded and closed the weekly candle at 1.3446

Stefan Doll 11:38 2025-06-23 UTC+2

Technical Analysis for the Week of June 23–28: EUR/USD Currency Pair

Last week, the pair moved downward and tested the 76.4% pullback level at 1.1452 (red dashed line), after which the price rebounded and closed the weekly candle at 1.1520

Stefan Doll 11:31 2025-06-23 UTC+2

Forecast for EUR/USD on June 23, 2025

On Friday, the EUR/USD pair continued to rise after rebounding from the 76.4% corrective level at 1.1454. However, on Monday night, the pair returned to this level. A new rebound

Samir Klishi 11:24 2025-06-23 UTC+2

Forecast for GBP/USD on June 23, 2025

On the hourly chart, the GBP/USD pair on Friday consolidated below the support zone of 1.3425–1.3444, once again allowing for the expectation of a continued decline toward the support level

Samir Klishi 11:19 2025-06-23 UTC+2

Technical Analysis of Daily Price Movement of USD/IDR Exotic Currency Pairs, Monday June 23, 2025.

16473.27 Currently on the Daily chart, the Exotic USD/IDR currency pair has a Bullish 123 pattern which indicates that USD/IDR is currently strengthening, where this is also confirmed

Arief Makmur 07:29 2025-06-23 UTC+2

Technical Analysis of Intraday Price Movement of Crude Oil Commodity Instrument, Monday June 23, 2025.

In addition to the appearance of Divergence between the price movement of Crude Oil and the Stochastic Oscillator indicator on the 4-hour chart, there is also a Bearish 123 pattern

Arief Makmur 07:29 2025-06-23 UTC+2
Can't speak right now?
Ask your question in the chat.
Widget callback
 

Dear visitor,

Your IP address shows that you are currently located in the USA. If you are a resident of the United States, you are prohibited from using the services of InstaFintech Group including online trading, online transfers, deposit/withdrawal of funds, etc.

If you think you are seeing this message by mistake and your location is not the US, kindly proceed to the website. Otherwise, you must leave the website in order to comply with government restrictions.

Why does your IP address show your location as the USA?

  • - you are using a VPN provided by a hosting company based in the United States;
  • - your IP does not have proper WHOIS records;
  • - an error occurred in the WHOIS geolocation database.

Please confirm whether you are a US resident or not by clicking the relevant button below. If you choose the wrong option, being a US resident, you will not be able to open an account with InstaForex anyway.

We are sorry for any inconvenience caused by this message.