empty
30.01.2025 03:26 PM
EUR/USD: Trading Plan for the U.S. Session on January 30th (Review of Morning Trades)

In my morning forecast, I highlighted the 1.0390 level as a key entry point. However, due to low volatility, the pair did not reach this level for a false breakout formation, leaving me without trades. The technical outlook for the second half of the day remains unchanged.

This image is no longer relevant

Buying Strategy for EUR/USD

The weaker-than-expected Q4 GDP data for the eurozone exerted some pressure on the euro, but since many market participants had already anticipated this outcome, no major sell-off followed. Now, the market's reaction to the ECB's decision will be crucial. However, traders should also focus on U.S. economic data, including Q4 U.S. GDP growth and Initial Jobless Claims. A strong GDP reading exceeding forecasts could strengthen the U.S. dollar, while disappointing data might trigger renewed buying in EUR/USD.

If the market reacts negatively to the ECB's decision and U.S. data, I will look for buying opportunities near the 1.0391 support level, which was formed yesterday. A false breakout at 1.0391 would provide a good entry point for long positions, targeting the 1.0442 resistance level. A break and retest of 1.0442 from above would confirm further bullish momentum, aiming for 1.0490, marking a strong counterattack by euro buyers. The final target will be 1.0531, where I will take profits.

However, if EUR/USD continues to decline and fails to hold at 1.0391, it could invalidate bullish prospects for the near term. In this case, sellers could push the pair down to 1.0343. Only a false breakout at 1.0343 would justify opening long positions. If the decline extends further, I will consider buying from 1.0311 for an intraday correction of 30-35 points.

Selling Strategy for EUR/USD

Sellers are once again targeting the 1.0391 support level, suggesting that the most interesting moves are still ahead. If traders react positively to ECB President Christine Lagarde's statements, the 1.0442 resistance level will be critical in determining EUR/USD's next direction. A false breakout at 1.0442 would signal that large sellers remain active, providing a short entry opportunity with a target at 1.0391. A break and retest of 1.0391 from below would confirm further bearish momentum, leading to 1.0343. The final bearish target will be 1.0311, where I will take profits.

If EUR/USD rises in the second half of the day and sellers fail to act at 1.0442, I will postpone short positions until 1.0490 (next resistance). A false breakout at 1.0490 would provide a selling opportunity. If bullish momentum persists, I will consider selling from 1.0531, targeting a 30-35 pip correction.

This image is no longer relevant

COT Report (Commitments of Traders – January 21)

The latest COT data shows increases in both long and short positions, but overall market positioning remains bearish. Traders continue favoring short positions on EUR/USD, expecting that Trump's policies will eventually strengthen the U.S. dollar. The uncertainty surrounding the Federal Reserve's future policy also adds to market caution. Long non-commercial positions increased by 4,905, reaching 167,665. Short non-commercial positions surged by 6,994, totaling 230,151. As a result, the gap between long and short positions narrowed by 210.

This image is no longer relevant

Indicator Signals for EUR/USD

Moving Averages

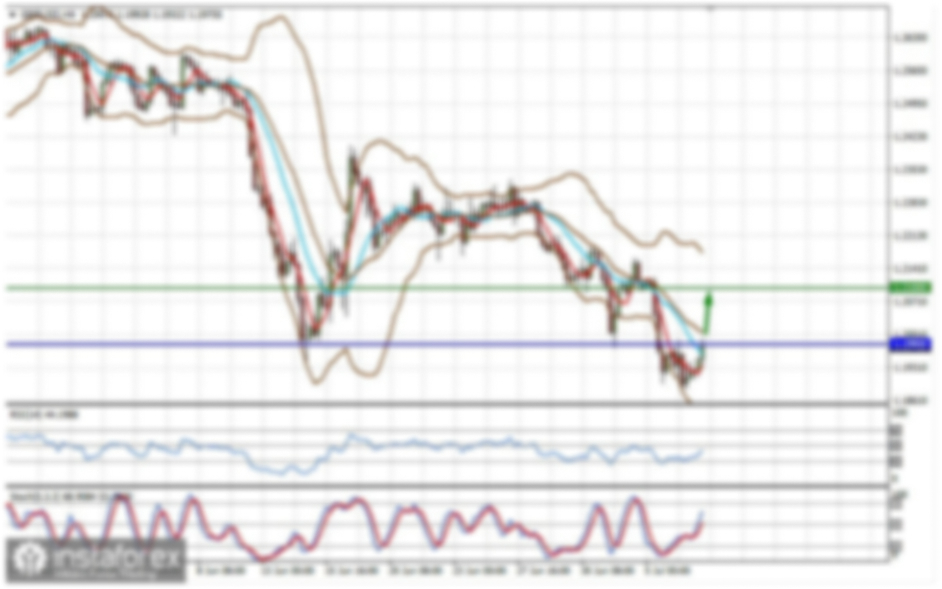
The pair is trading below the 30-day and 50-day moving averages, indicating continued pressure on the euro.

Note: The author uses hourly (H1) moving averages, which differ from the standard daily (D1) moving averages.

Bollinger Bands

If EUR/USD declines, the lower Bollinger Band near 1.0390 will act as support.

Indicator Descriptions

Moving Averages (MA):

  • 50-period moving average – Identifies the current trend by smoothing out volatility and noise. Marked yellow on the chart.
  • 30-period moving average – Provides an additional trend indication. Marked green on the chart.

MACD (Moving Average Convergence/Divergence):

  • Fast EMA: 12-period.
  • Slow EMA: 26-period.
  • Signal Line (SMA): 9-period.
  • Used to identify trend direction and momentum shifts.

Bollinger Bands:

  • Period: 20.
  • Helps determine volatility and potential support/resistance levels.

Non-Commercial Traders:

  • Includes speculators such as individual traders, hedge funds, and large institutions using the futures market for speculative purposes.

Position Data:

  • Long Non-Commercial Positions: Represents the total long (buy) open interest among non-commercial traders.
  • Short Non-Commercial Positions: Represents the total short (sell) open interest among non-commercial traders.
  • Net Non-Commercial Position: The difference between short and long positions, indicating overall market sentiment.
Miroslaw Bawulski,
Analytical expert of InstaForex
© 2007-2025
EURUSD
Euro vs US Dollar
Summary
Sell
Urgency
1 day
Analytic
Maxim Magdalinin
Start trade
Earn on cryptocurrency rate changes with InstaForex
Download MetaTrader 4 and open your first trade
  • Grand Choice
    Contest by
    InstaForex
    InstaForex always strives to help you
    fulfill your biggest dreams.
    JOIN CONTEST

Recommended Stories

GBP/USD: Trading Plan for the U.S. Session on February 20th (Review of Morning Trades)

In my morning forecast, I highlighted 1.2590 as a key level for making trading decisions. Looking at the 5-minute chart, we can see that a break and retest of 1.2590

Miroslaw Bawulski 14:11 2025-02-20 UTC+2

EUR/USD: Trading Plan for the U.S. Session on February 20th (Review of Morning Trades)

In my morning forecast, I highlighted the 1.0441 level as a key decision point for market entry. Looking at the 5-minute chart, we can see that the pair attempted

Miroslaw Bawulski 14:08 2025-02-20 UTC+2

How to Trade the GBP/USD Pair on February 20? Simple Tips and Trade Analysis for Beginners

Analysis of Wednesday's Trades 1H Chart of GBP/USD On Wednesday, the GBP/USD pair continued to trade in a sideways manner. For the second consecutive day, traders had ample reason

Paolo Greco 06:29 2025-02-20 UTC+2

How to Trade the EUR/USD Pair on February 20? Simple Tips and Trade Analysis for Beginners

Analysis of Wednesday's Trades 1H Chart of EUR/USD On Wednesday, the EUR/USD currency pair continued to experience minimal volatility and a downward trend. Throughout the day, several macroeconomic reports were

Paolo Greco 06:29 2025-02-20 UTC+2

Trading Recommendations and Analysis for GBP/USD on February 20: The British Pound Retreats from the 26 Level

The GBP/USD currency pair experienced a decline on Wednesday, which seemed illogical. In our previous analyses, we have noted similar irrational intraday movements occurring frequently. On Tuesday, two economic reports

Paolo Greco 02:35 2025-02-20 UTC+2

Trading Recommendations and Analysis for EUR/USD on February 20: The Euro Struggled Under Pressure

The EUR/USD currency pair continued its downward trend on Wednesday, a movement that began on Monday. Although volatility remains low, this has not prevented the euro from declining. By Wednesday

Paolo Greco 02:35 2025-02-20 UTC+2

GBP/USD: Trading Plan for the U.S. Session on February 19th

In my morning analysis, I focused on 1.2631 as a key level for making trading decisions. A rise followed by a false breakout at this level provided an ideal scenario

Miroslaw Bawulski 18:06 2025-02-19 UTC+2

EUR/USD: Trading Plan for the U.S. Session on February 19th

In my morning analysis, I highlighted the 1.0437 level as a key decision point for entering the market. Reviewing the five-minute chart, a false breakout occurred around this level, providing

Miroslaw Bawulski 18:02 2025-02-19 UTC+2

How to Trade the GBP/USD Pair on February 19? Simple Tips and Trade Analysis for Beginners

Analysis of Tuesday's Trades 1H Chart of GBP/USD On Tuesday, the GBP/USD pair remained stagnant for the second consecutive day. Market volatility is currently at a minimum, preventing the pound

Paolo Greco 06:47 2025-02-19 UTC+2

How to Trade the EUR/USD Pair on February 19? Simple Tips and Trade Analysis for Beginners

Analysis of Tuesday's Trades 1H Chart of EUR/USD On Tuesday, the EUR/USD currency pair experienced minimal volatility and a downward bias. There were no significant macroeconomic releases throughout

Paolo Greco 06:47 2025-02-19 UTC+2
Can't speak right now?
Ask your question in the chat.
Widget callback
 

Dear visitor,

Your IP address shows that you are currently located in the USA. If you are a resident of the United States, you are prohibited from using the services of InstaFintech Group including online trading, online transfers, deposit/withdrawal of funds, etc.

If you think you are seeing this message by mistake and your location is not the US, kindly proceed to the website. Otherwise, you must leave the website in order to comply with government restrictions.

Why does your IP address show your location as the USA?

  • - you are using a VPN provided by a hosting company based in the United States;
  • - your IP does not have proper WHOIS records;
  • - an error occurred in the WHOIS geolocation database.

Please confirm whether you are a US resident or not by clicking the relevant button below. If you choose the wrong option, being a US resident, you will not be able to open an account with InstaForex anyway.

We are sorry for any inconvenience caused by this message.