signal strength 1 of 5
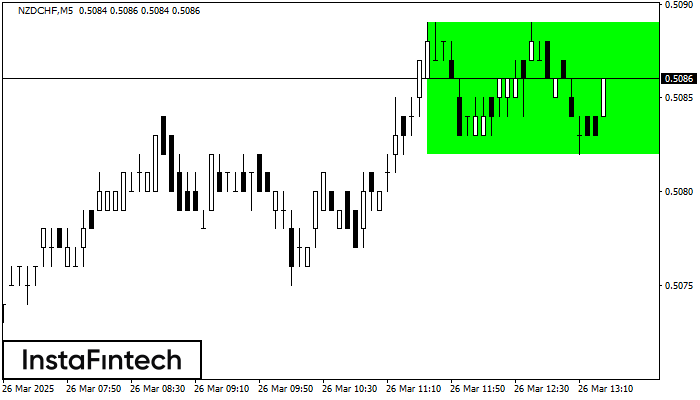
According to the chart of M5, NZDCHF formed the Bullish Rectangle. This type of a pattern indicates a trend continuation. It consists of two levels: resistance 0.5089 and support 0.5082. In case the resistance level 0.5089 - 0.5089 is broken, the instrument is likely to follow the bullish trend.
The M5 and M15 time frames may have more false entry points.
Juga lihat
- All
- Double Top
- Flag
- Head and Shoulders
- Pennant
- Rectangle
- Triangle
- Triple top
- All
- #AAPL
- #AMZN
- #Bitcoin
- #EBAY
- #FB
- #GOOG
- #INTC
- #KO
- #MA
- #MCD
- #MSFT
- #NTDOY
- #PEP
- #TSLA
- #TWTR
- AUDCAD
- AUDCHF
- AUDJPY
- AUDUSD
- EURCAD
- EURCHF
- EURGBP
- EURJPY
- EURNZD
- EURRUB
- EURUSD
- GBPAUD
- GBPCHF
- GBPJPY
- GBPUSD
- GOLD
- NZDCAD
- NZDCHF
- NZDJPY
- NZDUSD
- SILVER
- USDCAD
- USDCHF
- USDJPY
- USDRUB
- All
- M5
- M15
- M30
- H1
- D1
- All
- Buy
- Sale
- All
- 1
- 2
- 3
- 4
- 5
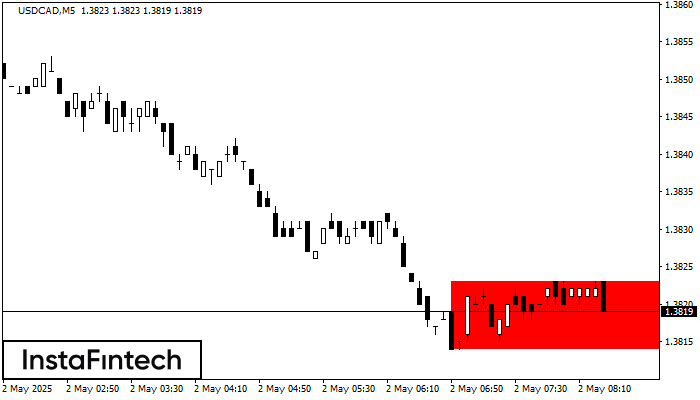
De acordo com o gráfico de M5, USDCAD formou Retângulo de baixa que é um padrão de uma continuação de tendência. O padrão está dentro dos seguintes limites: limite inferior
Os intervalos M5 e M15 podem ter mais pontos de entrada falsos.
Open chart in a new window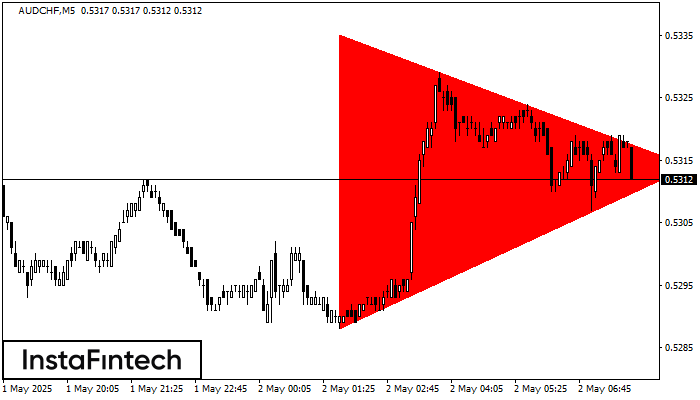
De acordo com o gráfico de M5, AUDCHF formou o padrão de Triângulo Simétrico de Baixa. Recomendações de negociação: Uma quebra do limite inferior de 0.5288 pode encorajar a continuação
Os intervalos M5 e M15 podem ter mais pontos de entrada falsos.
Open chart in a new window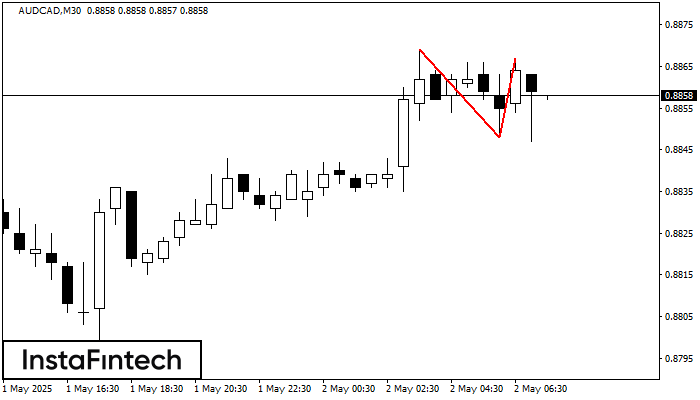
O padrão Topo duplo foi formado em AUDCAD M30. Isso sinaliza que a tendência foi alterada de cima para baixo. Provavelmente, se a base do padrão 0.8848 for quebrada
Open chart in a new window