empty
17.05.2023 12:15 AM
Technical analysis of GBP/USD for May 15, 2023

This image is no longer relevant

Overview :

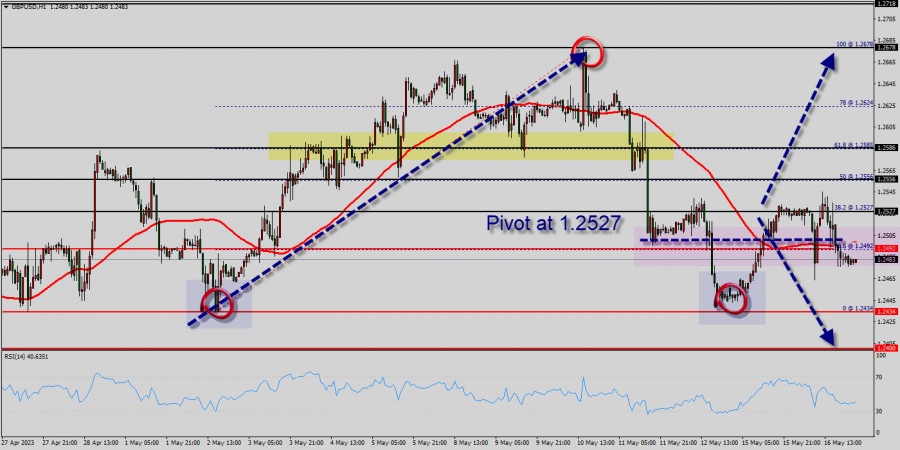
The GBP/USD pair traded higher and closed the day in the positive territory near the price of 1.2466. Right now, it was trading in a narrow range of 1.2466 staying close to a 3-days high. On the hourly chart, the GBP/USD pair is still trading above the MA (100) H1 moving average line (1.2461 - weekly pivot point). The situation is similar on the 4-hour chart. Based on the foregoing, it is probably worth sticking to the north direction in trading, and as long as the GBP/USD pair remains above MA 100 H1, it may be necessary to look for entry points to buy for the formation of a correction.

All elements being clearly bullish, it would be possible for traders to trade only long positions on the GBP/USD pair as long as the price remains well above the golden ratio of 1.2461. The buyers' bullish objective is set at 1.2583. The price is likely to form a double top in the same time frame. Accordingly, the GBP/USD pair is showing signs of strength following a breakout of the highest level of 1.2583. So, buy above the level of 1.2461 with the first target at 1.2583 in order to test the daily resistance 1. The level of 1.2583 is a good place to take profits. Moreover, the RSI is still signaling that the trend is upward as it remains strong above the moving average (100). This suggests that the pair will probably go up in coming hours. A bullish break in this resistance would boost the bullish momentum.

Pound Sterling is currently trading at 1.2466. If the trend reverses from this point, then a possible future share price target could be 1.2400. If the price of Pound Sterling is trading above 1.2583 then possibility of upside targets getting achieved is higher around the level of 1.2783. The basic bullish trend is very strong on the GBP/USD pair, but the short term shows some signs of running out of steam. Nevertheless, a purchase could be considered as long as the price remains above 1.2461.

Crossing the first resistance at 1.2583 would be a sign of a potential new surge in the price. Buyers would then use the next resistance located at 1.2583 as an objective. Crossing it would then enable buyers to target 1.2583. Caution, a return to below 1.2583 would be a sign of a consolidation phase in the short-term basic trend. If this is the case, remember that trading against the trend may be riskier. It would seem more appropriate to wait for a signal indicating reversal of the trend. In the very short term, the general bullish sentiment is not called into question, despite technical indicators being indecisive. All elements being clearly bullish market, it would be possible for traders to trade only long positions on the GBP/USD pair as long as the price remains well above the price of 1.2461.

A bullish break in this resistance would boost the bullish momentum. The buyers could then target the resistance located at 1.2583. This suggests that the pair will probably go up in coming hours. If the trend is able to break the level of 1.2583 (double top), then the market will call for a strong bullish market towards the objective of 1.2615 this week. It is also should be noted, beware of bullish excesses that could lead to a possible short-term correction; but this possible correction would not be tradeable. On the other hand, in case a reversal takes place and the GBP/USD pair breaks through the support level of 1.2432, a further decline to 1.2400 can occur. It would indicate a bearish market.

Mourad El Keddani,
Especialista em análise na InstaForex
© 2007-2025
Selecionar intervalo de tempo
5
min
15
min
30
min
1
hora
4
horas
1
dia
1
s.
Ganhe com as variações das taxas das criptomoedas com a InstaForex.
Baixe o MetaTrader 4 e abra a sua primeira operação.
  • Grand Choice
    Contest by
    InstaForex
    InstaForex always strives to help you
    fulfill your biggest dreams.
    PARTICIPE DO CONCURSO

Recommended Stories

EUR/USD. 4 de julho. 4 de julho. Os ursos continuam a se retirar do mercado

Na quinta-feira (3.07), o par EUR/USD recuperou mais uma vez do nível 1,1802 e caiu quase até o nível de retração de Fibonacci de 127,2% em 1,1712. Na manhã

Samir Klishi 17:30 2025-07-04 UTC+2

Sinais de negociação para o OURO (XAU/USD) para 4 a 8 de julho de 2025: vender abaixo de US$ 3.350 (SMA 21 - 3/8 de Murray)

Se o ouro conseguir se recuperar acima da EMA 200, atualmente em 3.327, poderemos esperar uma retração até 3.345. Essa região representa uma resistência importante e pode ser vista como

Dimitrios Zappas 16:09 2025-07-04 UTC+2

Previsão para o EUR/USD em 4 de julho de 2025

O principal evento de ontem esteve amplamente alinhado com nossas previsões — mais especificamente, ocorreu o esperado "ajuste numérico". Mas foi feito de maneira sutil, apenas o suficiente para interromper

Laurie Bailey 16:01 2025-07-04 UTC+2

Previsão para o GBP/USD em 4 de julho de 2025

No gráfico diário, a libra esterlina consolidou-se abaixo da linha MACD. Teve uma excelente oportunidade para também se consolidar abaixo do nível de suporte de 1,3635, mas essa tentativa falhou

Laurie Bailey 14:43 2025-07-04 UTC+2

Sinais de negociação para BITCOIN para 4 a 8 de julho de 2025: vender abaixo de US$ 110.610 (7/8 Murray - SMA 21)

Por outro lado, se o Bitcoin conseguir se manter firme acima do nível 7/8 de Murray, há espaço para ele avançar nos próximos dias e tentar romper a forte resistência

Dimitrios Zappas 14:40 2025-07-04 UTC+2

Previsão para o gás natural em 4 de julho de 2025

Gás natural (GN) A linha indicadora do saldo diário interrompeu drasticamente a alta dos preços de ontem — a quinta-feira encerrou com uma queda de 2,63%. A queda

Laurie Bailey 14:38 2025-07-04 UTC+2

GBP/USD. 4 de julho. Dia da Independência

No gráfico horário, o par GBP/USD na quinta-feira se recuperou da zona de suporte de 1,3611–1,3633, reverteu a favor da libra esterlina e agora tem todas as chances de continuar

Samir Klishi 14:22 2025-07-04 UTC+2

Previsão para a prata para 23 de julho de 2025

Após dois dias de intensa disputa (segunda e terça-feira) entre compradores (bulls) e vendedores (bears) ao longo da linha do canal de preços, em meio a alta volatilidade, ontem tivemos

Laurie Bailey 18:35 2025-07-03 UTC+2

Previsão para o EUR/AUD em 3 de julho de 2025

No gráfico diário, o par EUR/AUD está se movimentando de forma lateral na metade superior do canal de preços e acima da linha do indicador MACD. A linha de sinal

Laurie Bailey 17:16 2025-07-03 UTC+2
Não pode falar agora?
Faça sua pergunta no chat.
Widget callback
 

Dear visitor,

Your IP address shows that you are currently located in the USA. If you are a resident of the United States, you are prohibited from using the services of InstaFintech Group including online trading, online transfers, deposit/withdrawal of funds, etc.

If you think you are seeing this message by mistake and your location is not the US, kindly proceed to the website. Otherwise, you must leave the website in order to comply with government restrictions.

Why does your IP address show your location as the USA?

  • - you are using a VPN provided by a hosting company based in the United States;
  • - your IP does not have proper WHOIS records;
  • - an error occurred in the WHOIS geolocation database.

Please confirm whether you are a US resident or not by clicking the relevant button below. If you choose the wrong option, being a US resident, you will not be able to open an account with InstaForex anyway.

We are sorry for any inconvenience caused by this message.