empty
12.09.2023 11:49 AM
Technical Analysis of GBP/USD for September 12, 2023

Technical Market Outlook:

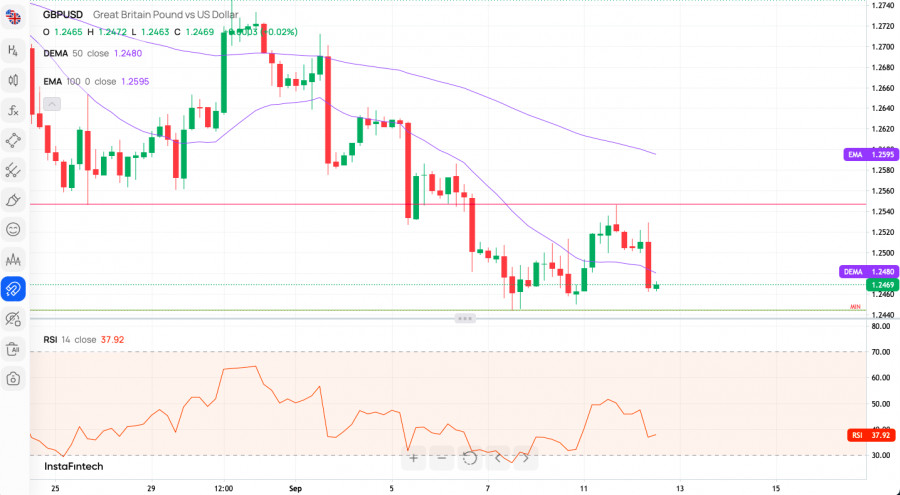
The GBP/USD pair has been moving lower on the H4 time frame chart after the bulls got rejected from the level of 1.2546 during the bounce attempt. The market still trades below the short-term trend line resistance, so any violation of the short-term support seen at the level of 1.2444 will extend the drop lower towards the level of 1.2393 and 1.2377. The intraday technical resistance is seen at the level of 1.2546 and the intraday technical support is seen at the level of 1.2450. The weak and negative momentum on the H4 time frame chart support the short-term bearish outlook for GBP, however, now is the time for bull to bounce higher and test the technical resistance.

This image is no longer relevant

Weekly Pivot Points:

WR3 - 1.26098

WR2 - 1.25569

WR1 - 1.25339

Weekly Pivot - 1.25040

WS1 - 1.24810

WS2 - 1.24511

WS3 - 1.23982

Trading Outlook:

The bulls were rejected at the key technical resistance located at the level of 1.3163 and a breakout above this level is needed to extend the up trend towards the last Weekly swing high seen at 1.4248. The weekly time frame chart shows the Bearish Engulfing candlestick pattern was made during the breakout attempt above the 1.3163, so now the bears are in charge of the market. Any sustained breakout below the technical support seen at the level of 1.1775 would dramatically increase the chances of another leg down towards the level of 1.1494.

Sebastian Seliga,
Especialista em análise na InstaForex
© 2007-2025
Selecionar intervalo de tempo
5
min
15
min
30
min
1
hora
4
horas
1
dia
1
s.
Ganhe com as variações das taxas das criptomoedas com a InstaForex.
Baixe o MetaTrader 4 e abra a sua primeira operação.
  • Grand Choice
    Contest by
    InstaForex
    InstaForex always strives to help you
    fulfill your biggest dreams.
    PARTICIPE DO CONCURSO

Recommended Stories

USD/CAD. Análise e previsão

Na sexta-feira, o par USD/CAD permanece sob pressão pelo segundo dia consecutivo, influenciado por uma combinação de fatores negativos. Os dados macroeconômicos dos EUA divulgados ontem vieram abaixo do esperado

Irina Yanina 15:54 2025-05-16 UTC+2

Previsão para o EUR/USD para 16 de maio de 2025

No mercado calmo de ontem, apesar da divulgação de vários dados econômicos da Europa e dos EUA, o euro ainda conseguiu avançar 13 pips. Isso, no mínimo, confirma a intenção

Laurie Bailey 15:03 2025-05-16 UTC+2

Previsão para o GBP/USD para 16 de maio de 2025

Na quinta-feira, o Reino Unido divulgou dados sólidos sobre o PIB, mas isso não desencadeou uma movimentação significativa no mercado de câmbio, já que o crescimento veio apenas do setor

Laurie Bailey 14:55 2025-05-16 UTC+2

Previsão para o par USD/JPY para 16 de maio de 2025

A sexta-feira pode marcar o quarto dia consecutivo de uma vela diária de baixa (preta). A última vez que esse padrão ocorreu foi de 3 a 6 de fevereiro. Nesse

Laurie Bailey 14:53 2025-05-16 UTC+2

Previsão para o USD/CAD para 16 de maio de 2025

Nos últimos quatro dias, o preço não conseguiu ultrapassar o nível de resistência de 1,4010, não que tenha feito uma grande tentativa. Ontem, o preço reverteu a partir de onde

Laurie Bailey 14:52 2025-05-16 UTC+2

Previsão para o Bitcoin em 16 de maio de 2025

A consolidação de sete dias do Bitcoin acima do nível 102.698 parece estar chegando ao fim. Aguardamos a confirmação final do oscilador Marlin, que precisa se recuperar do limite inferior

Laurie Bailey 14:50 2025-05-16 UTC+2

Previsão para o GBP/USD em 16 de maio de 2025

No gráfico horário, o par GBP/USD na quinta-feira reverteu mais uma vez a favor da libra esterlina e começou um movimento renovado em direção à zona de resistência de 1,3344-1,3357

Samir Klishi 14:34 2025-05-16 UTC+2

Índice do dólar americano (DXY). Análise e previsão

O Índice do Dólar dos EUA, que acompanha o desempenho do dólar americano em relação a uma cesta de moedas principais, continua operando com viés baixista pelo segundo dia consecutivo

Irina Yanina 14:02 2025-05-16 UTC+2

Análise técnica do movimento diário de preços do par USD/IDR, quinta-feira, 15 de maio de 2025

Com base no gráfico diário, o par de moedas exóticas USD/IDR apresenta um padrão de baixa 123, seguido pela formação de dois Ganchos de Ross (RH) também de baixa. Isso

Arief Makmur 22:46 2025-05-15 UTC+2
Não pode falar agora?
Faça sua pergunta no chat.
Widget callback
 

Dear visitor,

Your IP address shows that you are currently located in the USA. If you are a resident of the United States, you are prohibited from using the services of InstaFintech Group including online trading, online transfers, deposit/withdrawal of funds, etc.

If you think you are seeing this message by mistake and your location is not the US, kindly proceed to the website. Otherwise, you must leave the website in order to comply with government restrictions.

Why does your IP address show your location as the USA?

  • - you are using a VPN provided by a hosting company based in the United States;
  • - your IP does not have proper WHOIS records;
  • - an error occurred in the WHOIS geolocation database.

Please confirm whether you are a US resident or not by clicking the relevant button below. If you choose the wrong option, being a US resident, you will not be able to open an account with InstaForex anyway.

We are sorry for any inconvenience caused by this message.