empty
31.01.2023 11:32 AM
EUR/USD and GBP/USD technical analysis on January 31, 2023

EUR/USD

This image is no longer relevant

Higher time frames

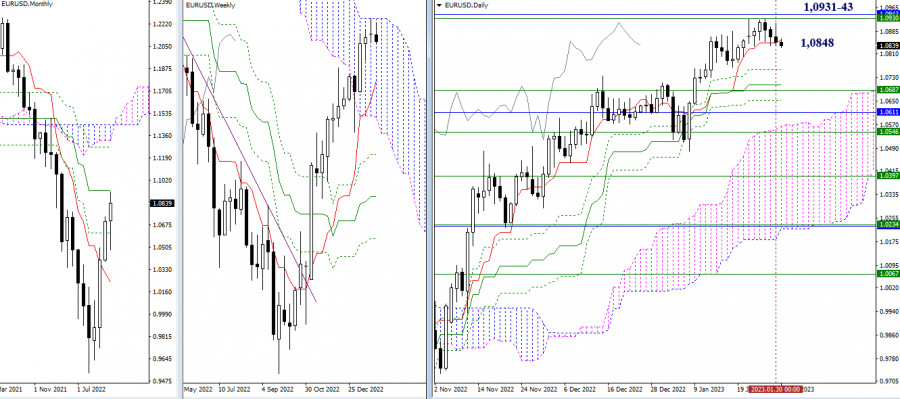
The situation has not changed much over the past 24 hours. The pair is still holding near the support level of the daily short-term trend (1.0848). Consolidation below this level and a further decline will bring the price to the lower levels of the daily Ichimoku Cross at 1.0759 – 1.0706 – 1.0653 and the weekly short-term trend at 1.0687. The bearish scenario is more likely in current conditions for various reasons. If bulls return to the market at some point, their main target will be the key resistance of 1.0931-43 (upper boundary of the weekly Ichimoku Cloud + monthly medium-term trend).

This image is no longer relevant

H4 – H1

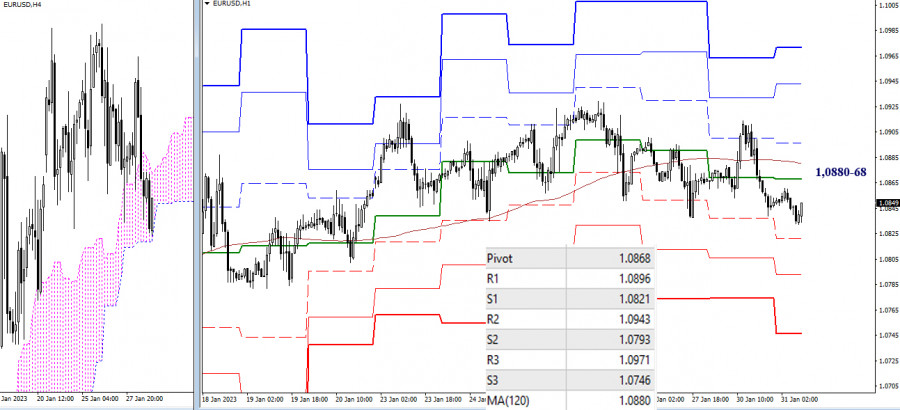
Bears are taking over the pair on lower time frames. The pair is currently trading below the central pivot level of 1.0868 and the weekly long-term trend of 1.0880. The next downward targets on the intraday chart are found at the support of standard pivot levels of 1.0821 – 1.0793 – 1.0746. A breakout of the Ichimoku Cloud on H4 and consolidation in the selling zone will support the bearish trend and will send the price for a new breakout.

***

GBP/USD

This image is no longer relevant

Higher time frames

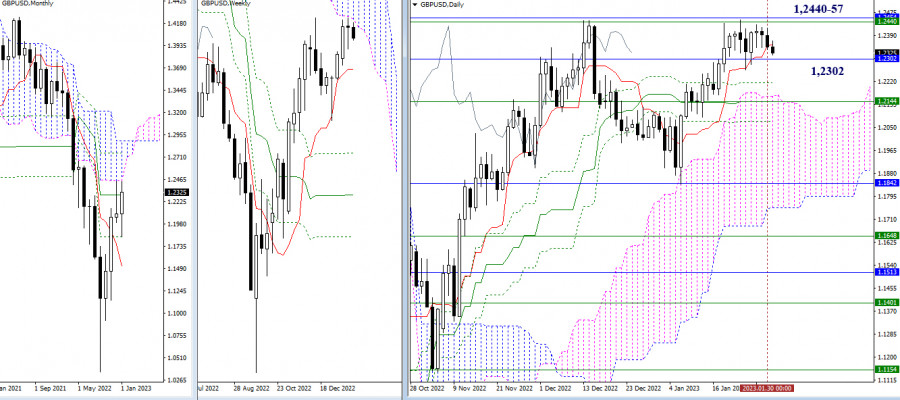
The daily short-term trend has slightly shifted from the level of 1.2302. The pair is still trading in the range between 1.2457-40 (upper boundaries of Ichimoku Clouds on monthly and weekly time frames) and 1.2302 (monthly medium-term trend). If the price leaves these boundaries, it may develop a new trajectory.

This image is no longer relevant

H4 – H1

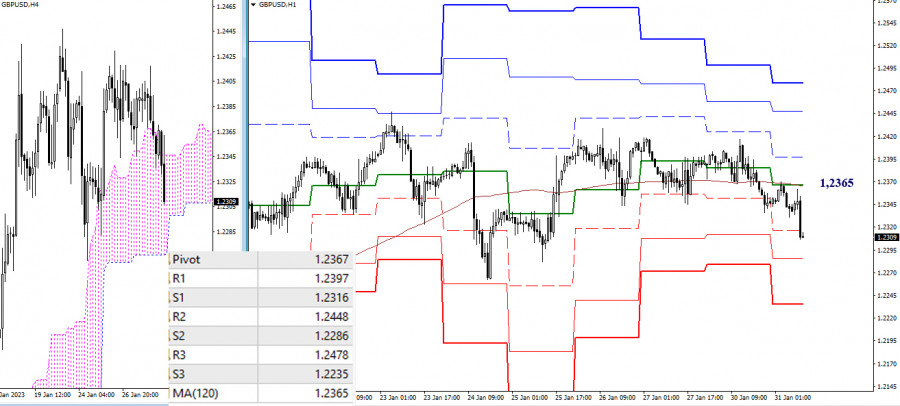
On lower time frames, the price has slipped below the key levels found at 1.2367-65 (central pivot level + weekly long-term trend). Trading below this range will support the sellers. Other intraday targets for bears are located at standard pivot levels of 1.2286 and 1.2235 as well as at the lower boundary of the cloud on H4. If the price settles outside the H4 cloud, it may head lower for new downward targets.

***

Technical analysis is based on:

Higher time frames – Ichimoku Kinko Hyo (9.26.52) + Fibo Kijun levels

Lower time frames – H1: Pivot Points (standard) + 120-day Moving Average (weekly long-term trend)

เลือกช่วงเวลา
5
นาที
15
นาที
30
นาที
1
ชั่วโมง
4
ชั่วโมง
1
วัน
1
สัปดาห์
รับผลกำไรจากการเปลี่ยนแปลงอัตราสกุลเงินดิจิทัลกับ InstaForex.
ดาวน์โหลด MetaTrader 4 และเปิดการซื้อขายครั้งแรกของคุณ.
  • Grand Choice
    Contest by
    InstaForex
    InstaForex always strives to help you
    fulfill your biggest dreams.
    เข้าร่วมการแข่งขัน


บทความแนะนำ

EUR/USD – วันที่ 11 เมษายน แนวโน้มขาลงของดอลลาร์ยังไม่มีทีท่าจะหยุด

เมื่อวันพฤหัสบดี คู่สกุลเงิน EUR/USD ใช้เวลาทั้งวันในทิศทางขาขึ้น โดยเพิ่มขึ้นถึง 400 จุด และเข้าใกล้ระดับ Fibonacci แก้ไขที่ 261.8% ที่ 1.1318 การดีดกลับจากระดับนี้หรือจาก 1.1374

Samir Klishi 12:36 2025-04-11 UTC+2

การคาดการณ์สำหรับ GBP/USD ในวันที่ 11 เมษายน 2025

ในกราฟรายชั่วโมง คู่สกุลเงิน GBP/USD ยังคงเคลื่อนที่สูงขึ้นในวันพฤหัสบดีและสามารถยืนอยู่เหนือระดับการปรับตัว 127.2% ที่ 1.3003 ได้เมื่อถึงเช้าวันศุกร์ ซึ่งบ่งบอกว่าการเคลื่อนที่ขึ้นอาจจะต่อเนื่องไปยังระดับถัดไปที่ 1.3151 หากคู่สกุลเงินตกลงต่ำกว่าระดับ 1.3003 จะเป็นการยืนยันทิศทางที่เป็นบวกต่อดอลลาร์สหรัฐฯ และส่งสัญญาณการลดลงไปยังระดับ 1.2931

Samir Klishi 12:32 2025-04-11 UTC+2

คาดการณ์ค่าเงิน Forex 11/04/2025: EUR/USD, GBP/USD, SP500, NASDAQ และ Bitcoin

ลิงค์ที่เป็นประโยชน์: บทความอื่นๆ ของฉันสามารถอ่านได้ในส่วนนี้ คอร์ส InstaForex สำหรับผู้เริ่มต้น การวิเคราะห์ยอดนิยม เปิดบัญชีการซื้อขาย คำเตือน: ผู้เริ่มต้นในการซื้อขายฟอเร็กซ์จำเป็นต้องระมัดระวังอย่างมากเมื่อตัดสินใจเข้าสู่ตลาด ก่อนที่รายงานสำคัญจะออกมา ควรหลีกเลี่ยงการเข้าสู่ตลาดเพื่อไม่ให้เจอการเปลี่ยนแปลงของตลาดที่รวดเร็วโดยเนื่องจากความผันผวนที่เพิ่มขึ้น หากคุณตัดสินใจจะซื้อขายในช่วงที่มีการประกาศข่าว ควรวางแผนการหยุดเพื่อจำกัดการขาดทุนเสมอ หากไม่วางแผนการหยุด

Sebastian Seliga 09:52 2025-04-11 UTC+2

การคาดการณ์ EUR/USD สำหรับวันที่ 11 เมษายน 2025

ตลอดทั้งวันเมื่อวานและเช้านี้ ยูโรได้บรรลุถึงช่วงเป้าหมายระหว่าง 1.1385–1.1420 ซึ่งสอดคล้องกับราคาสูงสุดในเดือนมิถุนายน 2019 และ 2020 เส้นสัญญาณของออสซิลเลเตอร์ Marlin ได้ชะลอตัวขึ้นในโซนที่ซื้อเกิน โดยมีระดับสูงสุดที่เคยเห็นเมื่อวันที่ 11 มีนาคมที่ผ่านมา ยังไม่มีสัญญาณอื่น

Laurie Bailey 05:03 2025-04-11 UTC+2

คาดการณ์คู่สกุลเงิน GBP/USD สำหรับวันที่ 11 เมษายน 2568

ค่าเงินปอนด์อังกฤษได้ไปถึงระดับเป้าหมายที่ 1.3001 แล้ว เส้นสัญญาณของออสซิลเลเตอร์ Marlin กำลังทะลุผ่านเส้นศูนย์เข้าสู่พื้นที่ขาขึ้น ซึ่งเปิดทางไปสู่ระดับ 1.3101 การทะลุผ่านเหนือระดับนั้นจะทำให้คู่เงินสามารถมุ่งเป้าหมายไปสู่ช่วง 1.3184–1.3208 ได้ ภาวะกดดันจากตลาดหุ้นและสินค้าโภคภัณฑ์ที่อ่อนแอ ทำให้ความเชื่อมั่นขาขึ้นลดลง ลดโอกาสของสถานการณ์ขาขึ้นหลัก หากแท่งเทียนรายวันวันนี้ปิดเป็นขาลง

Laurie Bailey 05:03 2025-04-11 UTC+2

การคาดการณ์คู่สกุลเงิน USD/JPY สำหรับวันที่ 11 เมษายน 2025

เมื่อวานนี้ คู่สกุลเงิน USD/JPY ได้ทะลุผ่านช่วงแนวรับที่กว้าง 145.08/91 อย่างแน่วแน่ และไปถึงระดับเป้าหมายที่ 143.45 ในช่วงการซื้อขายของแปซิฟิกวันนี้ ออสซิลเลเตอร์ Marlin เพิ่งเริ่มเคลื่อนไหวลึกเข้าสู่แนวโน้มขาลง แต่มีแรงขับเพียงพอที่จะดันราคาลงไปถึงระดับเป้าหมายที่ 139.59 (จุดต่ำสุดจากวันที่

Laurie Bailey 05:03 2025-04-11 UTC+2

สัญญาณการซื้อขายสำหรับทองคำ (XAU/USD) วันที่ 10-12 เมษายน 2025: ขายต่ำกว่า $3,145 (21 SMA - 8/8 Murray)

ในช่วงเช้าของตลาดสหรัฐฯ ทองคำซื้อขายอยู่ที่ประมาณ 3,120 ใกล้กับระดับต้าน 8/8 Murray เราเชื่อว่าทองคำอาจมีการปรับตัวทางเทคนิคที่แข็งแกร่งในชั่วโมงถัดไป หลังจากหาจุดสนับสนุนที่ดีใกล้กับระดับ 6/8 ของ Murray 2,968 ทองคำได้ฟื้นตัวอย่างแข็งแกร่งไปยังระดับ 3,130 ดังนั้น

Dimitrios Zappas 15:37 2025-04-10 UTC+2

EUR/USD วันที่ 10 เมษายน: ทรัมป์ยังคงสร้างความผันผวนให้ตลาด

ในวันพุธ คู่เงิน EUR/USD ได้เกิดการดีดตัวสองครั้งจากโซนแนวต้านที่ 1.1081–1.1095 ซึ่งเป็นการสนับสนุนให้กับเงินดอลลาร์สหรัฐ และลดลงสู่โซนแนวรับที่ 1.0944–1.0957 การดีดตัวจากโซนนี้จะเป็นประโยชน์ต่อเงินยูโรและอาจกระตุ้นให้เกิดการเติบโตกลับไปยังระดับ 1.1081–1.1095 ในปัจจุบัน ฉันยังไม่คาดหวังถึงการลดลงที่ลึกลงไป แม้ว่าหลายอย่างจะขึ้นอยู่กับสถานการณ์ข้อมูล ซึ่งเนื่องจากทรัมป์ ยังคงมีความผันผวนสูง

Samir Klishi 12:19 2025-04-10 UTC+2

การคาดการณ์สำหรับ GBP/USD ในวันที่ 10 เมษายน 2025

ในกราฟรายชั่วโมง คู่สกุลเงิน GBP/USD ได้รีบาวด์จากระดับ 1.2865 ในวันพุธ และมีการลดลงเล็กน้อย จากนั้นในวันนี้กลับมาที่ระดับเดิมอีกครั้ง การรีบาวด์อีกครั้งจากระดับนี้จะเป็นสัญญาณที่ดีสำหรับดอลลาร์สหรัฐและบ่งชี้ถึงการลดลงไปยังระดับ 1.2709 การปรับตัวขึ้นเหนือระดับ 1.2865 จะเพิ่มโอกาสในการเติบโตต่อไปสู่ระดับแนวต้านถัดไปที่ 1.2931 สถานการณ์คลื่นได้กลายเป็นที่สับสนในช่วงหลังนี้

Samir Klishi 12:12 2025-04-10 UTC+2

การคาดการณ์ Forex วันที่ 10/04/2025: EUR/USD, SP500, NASDAQ, Dow Jones, USDX และ Bitcoin

ลิงก์ที่เป็นประโยชน์: บทความอื่น ๆ ของฉันมีให้ในส่วนนี้ หลักสูตร InstaForex สำหรับผู้เริ่มต้น การวิเคราะห์ยอดนิยม เปิดบัญชีซื้อขาย สำคัญ: ผู้เริ่มต้นในการเทรดฟอเร็กซ์ควรระมัดระวังอย่างมากในการตัดสินใจเข้าตลาด ก่อนที่จะมีการเผยแพร่รายงานที่สำคัญ ควรจะอยู่ห่างจากตลาดเพื่อหลีกเลี่ยงความผันผวนที่แอบมากจากการเคลื่อนไหวของตลาดที่รุนแรงที่อาจเกิดขึ้น หากคุณตัดสินใจที่จะเทรดในช่วงที่มีการเผยแพร่ข่าว ให้ตั้งค่าหยุดคำสั่งเพื่อลดการขาดทุน

Sebastian Seliga 11:35 2025-04-10 UTC+2
หากไม่สะดวกคุยในตอนนี้
ระบุคำถามไว้ได้ใน แชท.
Widget callback
 

Dear visitor,

Your IP address shows that you are currently located in the USA. If you are a resident of the United States, you are prohibited from using the services of InstaFintech Group including online trading, online transfers, deposit/withdrawal of funds, etc.

If you think you are seeing this message by mistake and your location is not the US, kindly proceed to the website. Otherwise, you must leave the website in order to comply with government restrictions.

Why does your IP address show your location as the USA?

  • - you are using a VPN provided by a hosting company based in the United States;
  • - your IP does not have proper WHOIS records;
  • - an error occurred in the WHOIS geolocation database.

Please confirm whether you are a US resident or not by clicking the relevant button below. If you choose the wrong option, being a US resident, you will not be able to open an account with InstaForex anyway.

We are sorry for any inconvenience caused by this message.