Актуальні патерни
Патерни - це графічні моделі, які "малюють" ціни на графіку. Один з постулатів технічного аналізу говорить нам про те, що історія (рух ціни) завжди повторюється. Це означає, що в схожих ситуаціях рух ціни, найчастіше, буде схожим, що дозволяє з високою часткою ймовірності спрогнозувати подальший розвиток ситуації.
Актуальные паттерны
- Все
- Вымпел
- Голова и плечи
- Двойная вершина
- Прямоугольник
- Треугольник
- Тройная вершина
- Флаг
- Все
- #AAPL
- #AMZN
- #Bitcoin
- #EBAY
- #FB
- #GOOG
- #INTC
- #KO
- #MA
- #MCD
- #MSFT
- #NTDOY
- #PEP
- #TSLA
- #TWTR
- AUDCAD
- AUDCHF
- AUDJPY
- AUDUSD
- EURCAD
- EURCHF
- EURGBP
- EURJPY
- EURNZD
- EURRUB
- EURUSD
- GBPAUD
- GBPCHF
- GBPJPY
- GBPUSD
- GOLD
- NZDCAD
- NZDCHF
- NZDJPY
- NZDUSD
- SILVER
- USDCAD
- USDCHF
- USDJPY
- USDRUB
- Все
- M5
- M15
- M30
- H1
- D1
- Все
- Покупка
- Продажа
- Все
- 1
- 2
- 3
- 4
- 5
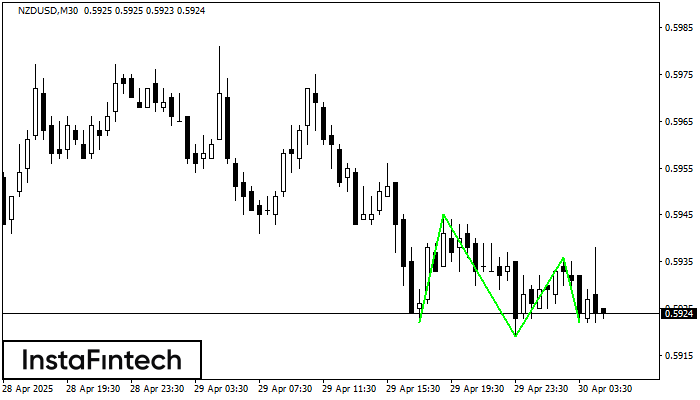
По торговому инструменту NZDUSD на M30 была сформирована графическая фигура «Тройное дно» с характеристиками: Уровень сопротивления 0.5936; Уровень поддержки 0.5922; Ширина 14 пунктов. В случае пробоя уровня сопротивления 0.5945 котировка
Открыть график инструмента в новом окне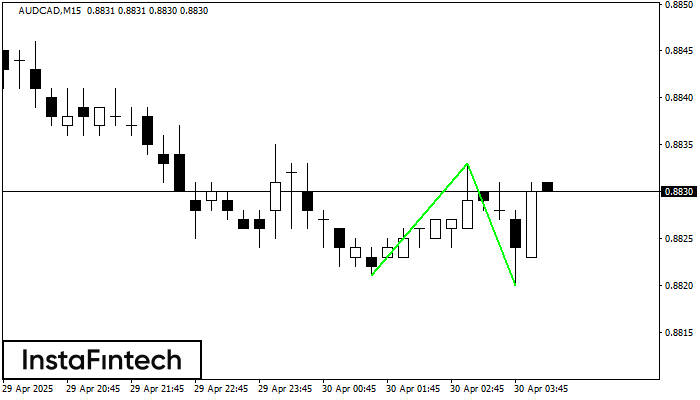
Сформирована фигура «Двойное дно» на графике AUDCAD M15. Данное формирование сигнализирует об изменении тенденции с нисходящего на восходящее движение. Сигнал: Торговую позицию на покупку следует открывать после пробоя верхней границы
Таймфреймы М5 и М15 могут иметь больше ложных точек входа.
Открыть график инструмента в новом окне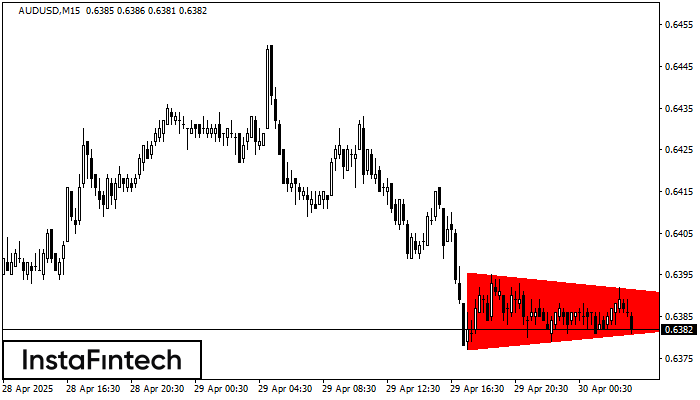
На графике AUDUSD M15 сформировалась фигура «Медвежий симметричный треугольник». Характеристика фигуры: Нижняя граница 0.6377/0.6386; Верхняя граница 0.6396/0.6386; Проекция ширины фигуры -19 пунктов. Формирование фигуры «Медвежий симметричный треугольник» наиболее вероятным образом
Таймфреймы М5 и М15 могут иметь больше ложных точек входа.
Открыть график инструмента в новом окне
На графике NZDCAD H1 сформировалась фигура «Медвежий флаг», которая сигнализирует о продолжении нисходящего тренда. В случае, если цена зафиксируется ниже минимума фигуры 0.8194, движение вниз, скорее всего, продолжится. Перспективой будущего
Открыть график инструмента в новом окне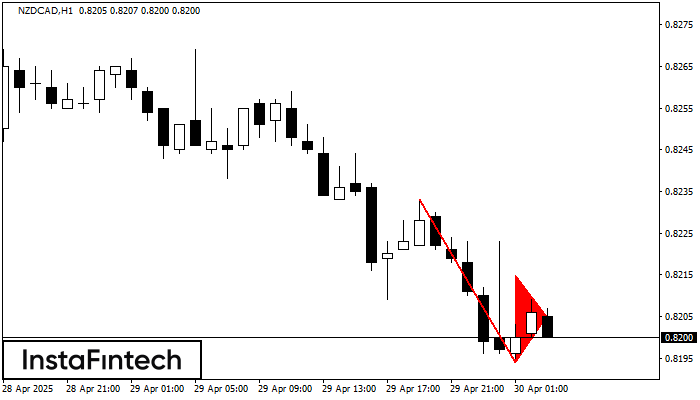
На графике NZDCAD H1 сформировалась фигура «Медвежий вымпел». Фигура сигнализирует о продолжении нисходящего тренда в случае пробоя минимума вымпела 0.8194. Рекомендации: Отложенный ордер Sell Stop выставляется на 10 пунктов ниже
Открыть график инструмента в новом окне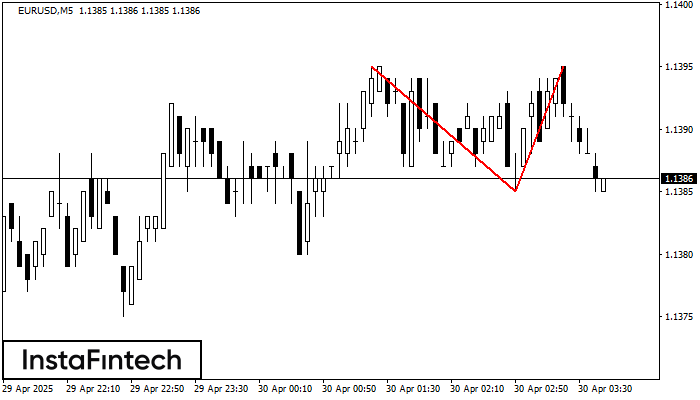
По EURUSD на M5 сформировалась разворотная фигура «Двойная вершина». Характеристика: Верхняя граница 1.1395; Нижняя граница 1.1385; Ширина фигуры 10 пунктов. Позицию на продажу возможно открыть ниже нижней границы 1.1385
Таймфреймы М5 и М15 могут иметь больше ложных точек входа.
Открыть график инструмента в новом окне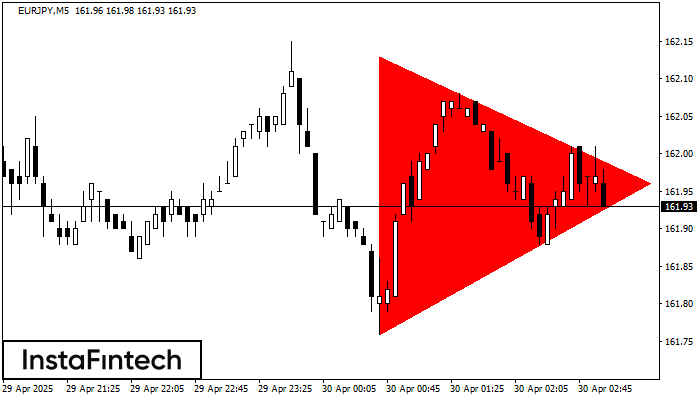
На графике EURJPY M5 сформировалась фигура «Медвежий симметричный треугольник». Характеристика фигуры: Нижняя граница 161.76/161.96; Верхняя граница 162.13/161.96; Проекция ширины фигуры -37 пунктов. Формирование фигуры «Медвежий симметричный треугольник» наиболее вероятным образом
Таймфреймы М5 и М15 могут иметь больше ложных точек входа.
Открыть график инструмента в новом окне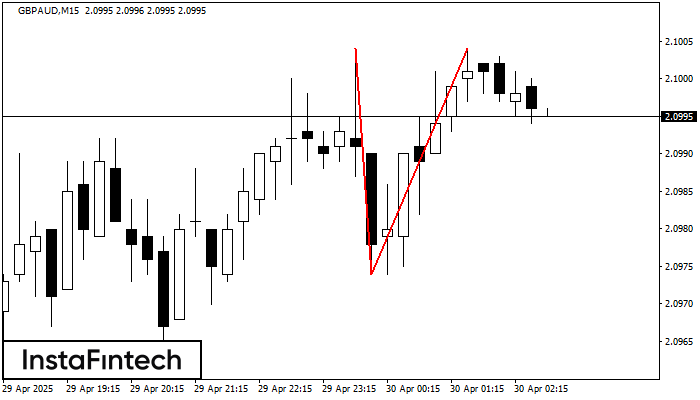
На торговом графике GBPAUD M15 сформировалась разворотная фигура «Двойная вершина». Характеристика: Верхняя граница 2.1004; Нижняя граница 2.0974; Ширина фигуры 30 пунктов. Сигнал: Пробой нижней границы 2.0974 приведет к дальнейшему нисходящему
Таймфреймы М5 и М15 могут иметь больше ложных точек входа.
Открыть график инструмента в новом окне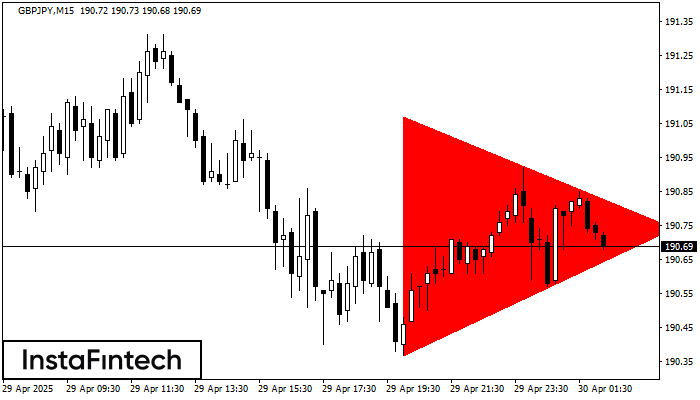
На графике GBPJPY на M15 сформировалась фигура «Медвежий симметричный треугольник». Торговые рекомендации: Пробой нижней границы 190.37 с большой долей вероятности приведет к продолжению нисходящего тренда
Таймфреймы М5 и М15 могут иметь больше ложных точек входа.
Открыть график инструмента в новом окне