empty
01.02.2022 11:22 AM
Technical analysis for EUR/USD pair on February 2022

Trend analysis

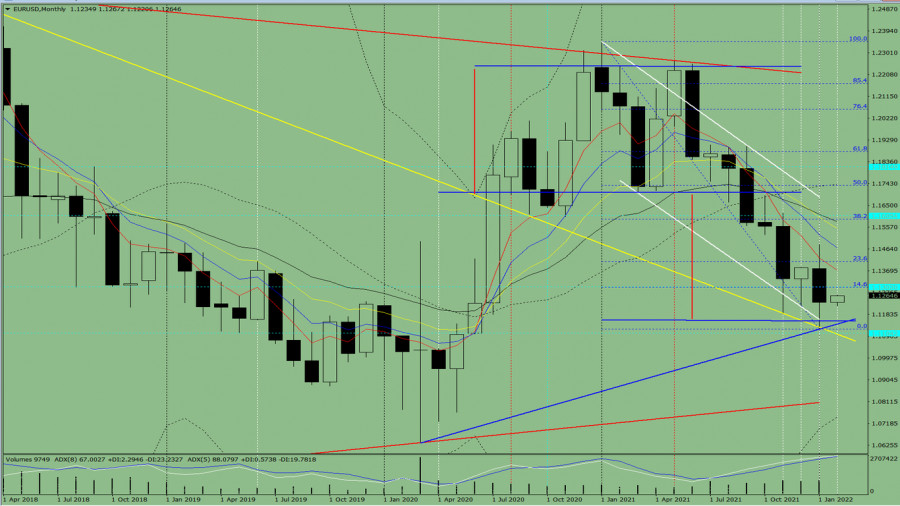
The price from the level of 1.1235 (closing of the January monthly candlestick) will most likely rise to the target of 1.1302 – the historical resistance level (blue dotted line) this month. After this level is reached, it may further increase to the target of 1.1409 – the pullback level of 23.6% (blue dotted line) and continue the upward movement to the target of 1.1590 – the pullback level of 38.2% (blue dotted line).

This image is no longer relevant

Fig. 1 (monthly chart)

Indicator analysis:

  • Indicator analysis - up
  • Fibonacci levels - up
  • Volumes - up
  • Candlestick analysis - up
  • Trend analysis - up
  • Bollinger bands - up

An upward movement can be concluded based on a comprehensive analysis.

The overall result of the candlestick calculation based on the monthly chart: the price will most likely move in an upward trend, both without the first lower shadow (the first week of the month is white) and without the second upper shadow (the last week is white) in the monthly white candlestick.

This month, the price from the level of 1.1235 (closing of the January monthly candlestick) will increase to the target of 1.1302 – the historical resistance level (blue dotted line). After reaching it, it may continue its growth to the target of 1.1409 – the pullback level of 23.6% (blue dotted line), and then further rise to the target of 1.1590 – the pullback level of 38.2% (blue dotted line).

Alternatively, the price from the level of 1.1235 (closing of the January monthly candlestick) may decline to the target of 1.1094 – the support line (thick yellow line). If this line is tested, it may now rise to the target of 1.1302 – the pullback level of 14.6% (blue dotted line) and continue moving up.

Stefan Doll,
Chuyên gia phân tích của InstaForex
© 2007-2025
Chọn khung thời gian
5
phút
15
phút
30
phút
1
giờ
4
ngày
1
ngày
1
tuần
Kiếm lợi nhuận từ những biến đổi giá của tiền điện tử với InstaForex.
Tải MetaTrader 4 và mở giao dịch đầu tiên của bạn.
  • Tiền gửi lần truy cập
    Ký quỹ tài khoản của bạn với $3000 và nhận được $9000 nhiều hơn!
    Trong Tháng 5 chúng tôi xổ $9000 trong chiến dịch Chancy Deposit!
    Có được một cơ hội giành chiến thắng bằng việc ký quỹ $3000 vào một tài khoản giao dịch. Đáp ứng được điều kiện này, bạn trở thành một người tham gia chiến dịch.
    THAM GIA CUỘC THI

Các bài báo được đề xuất

Tín hiệu giao dịch cho BITCOIN từ ngày 15-19 tháng 5, 2025: Bán dưới mức $103,600 (+1/8 Murray - 21 SMA)

Nếu Bitcoin không thể vượt qua mức 103,700, dự kiến sẽ có một đợt điều chỉnh kỹ thuật tiếp theo. Do đó, giá có thể chạm

Dimitrios Zappas 16:51 2025-05-15 UTC+2

Tín hiệu giao dịch cho VÀNG trong khoảng thời gian từ ngày 15 đến 19 tháng 5, 2025: mua trên $3,222 hoặc bán dưới $3,203 (200 EMA - 5/8 Murray)

Một cú đột phá quyết định trên 3,203 có thể báo hiệu sự kết thúc của xu hướng giảm và khởi đầu cho một chu kỳ tăng mới của vàng

Dimitrios Zappas 16:50 2025-05-15 UTC+2

Dự báo Forex 15/05/2025: EUR/USD, GBP/USD, Dầu và Bitcoin

Các liên kết hữu ích: Bài viết khác của tôi có sẵn trong phần này Khóa học InstaForex cho người mới bắt đầu Phân Tích Phổ Biến Mở tài khoản

Sebastian Seliga 11:22 2025-05-15 UTC+2

Dự báo cho EUR/USD vào ngày 15 tháng 5 năm 2025

Vào thứ Tư, cặp tỷ giá EUR/USD đã tăng lên gần vùng kháng cự 1.1265–1.1282, bật khỏi nó và quay đầu có lợi cho đồng đô la Mỹ, khi đồng

Samir Klishi 11:00 2025-05-15 UTC+2

Dự báo cho GBP/USD vào ngày 15 tháng 5, 2025

Trên biểu đồ giờ, cặp GBP/USD đã tăng lên vùng kháng cự 1.3344–1.3357 vào thứ Tư, bật ra từ đó và bắt đầu di chuyển xuống mức Fibonacci 100,0%

Samir Klishi 10:56 2025-05-15 UTC+2

Phân Tích Kỹ Thuật Chuyển Động Giá Hàng Ngày của Các Cặp Tiền Tệ Ngoại Lai USD/IDR, Thứ Năm Ngày 15 Tháng 5, 2025

Từ những gì thấy trên biểu đồ hàng ngày, cặp tiền Exotic USD/IDR dường như có một mô hình Bearish 123, tiếp theo là sự xuất hiện của 2 Bearish

Arief Makmur 06:46 2025-05-15 UTC+2

Phân Tích Kỹ Thuật về Biến Động Giá Trong Ngày của Chỉ Số Nasdaq 100, Thứ Năm, ngày 15 tháng 5 năm 2025

Nếu chúng ta xem biểu đồ 4 giờ của chỉ số Nasdaq 100 di chuyển trên WMA (21) có độ dốc đang đi lên, điều này cho thấy rằng hiện

Arief Makmur 06:46 2025-05-15 UTC+2

Dự báo tỷ giá EUR/USD cho ngày 15 tháng 5, 2025

Vào thứ Tư, đồng euro đã tăng lên mức mục tiêu 1.1266 (mức thấp nhất từ ngày 15 tháng 4 và ngày 1 tháng 5), nhưng do thiếu

Laurie Bailey 04:40 2025-05-15 UTC+2

Dự báo GBP/USD cho ngày 15 tháng 5, 2025

Đồng bảng Anh gặp khó khăn trong việc vượt qua mức kháng cự 1.3311 với một nến đóng cửa hàng ngày. Trong bối cảnh hiện tại, mức này đồng nhất

Laurie Bailey 04:40 2025-05-15 UTC+2

Dự báo USD/JPY cho ngày 15 tháng 5, năm 2025

Vào cuối phiên giao dịch ngày hôm qua, cặp tỷ giá USD/JPY đã giảm 73 pip, thử nghiệm đường chỉ báo MACD với bóng nến dưới. Rõ ràng

Laurie Bailey 04:40 2025-05-15 UTC+2
Không thể nói chuyện ngay bây giờ?
Đặt câu hỏi của bạn trong phần trò chuyện.
Widget callback
 

Dear visitor,

Your IP address shows that you are currently located in the USA. If you are a resident of the United States, you are prohibited from using the services of InstaFintech Group including online trading, online transfers, deposit/withdrawal of funds, etc.

If you think you are seeing this message by mistake and your location is not the US, kindly proceed to the website. Otherwise, you must leave the website in order to comply with government restrictions.

Why does your IP address show your location as the USA?

  • - you are using a VPN provided by a hosting company based in the United States;
  • - your IP does not have proper WHOIS records;
  • - an error occurred in the WHOIS geolocation database.

Please confirm whether you are a US resident or not by clicking the relevant button below. If you choose the wrong option, being a US resident, you will not be able to open an account with InstaForex anyway.

We are sorry for any inconvenience caused by this message.