empty
30.03.2023 01:28 PM
Technical analysis of BTC/USD for March 30, 2023

This image is no longer relevant

Trading BTC/USD :

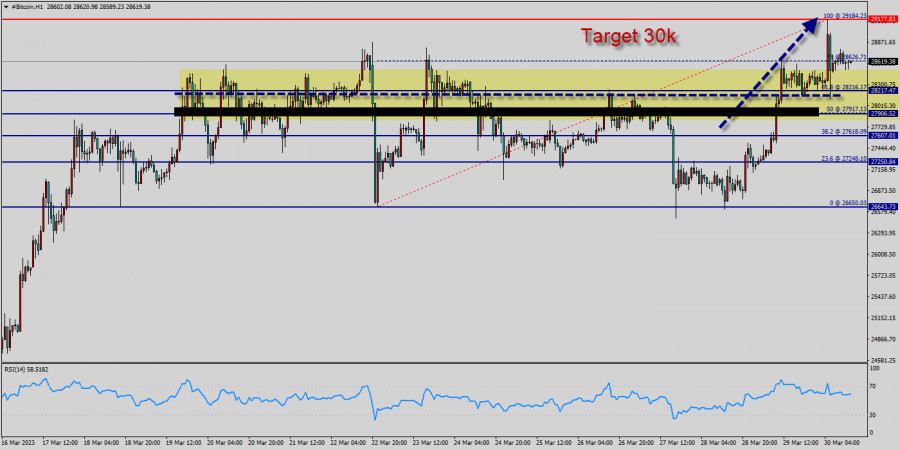
Bitcoin The bullish trend is currently very strong for BITCOIN - BTC/USD. As long as the price remains above the support at 28k USD, you could try to take advantage of the bullish rally in short term. The first bullish objective is located at 28,626 USD (this price is coincided with the ratio 78% of Fibonacci retracement levels).

The bullish momentum would be revived by a break in this resistance. Closing above the pivot point (28k USD) could assure that BTC/USD will move higher towards cooling new highs. The bulls must break through 29k USD in order to resume the up trend. Buyers would then use the next resistance located at 29,184 USD as an objective (this price is coincided with the ratio 100% of Fibonacci retracement levels - the double top - te last bullish wave on the hourly chart).

Crossing it would then enable buyers to target 29k USD. Be careful, given the powerful bullish rally underway, excesses could lead to a short-term rebound. Bitcoin's price has been consolidating between the 28k USD and 30k USD over the last few weeks, following a massive rising from the 28k USD mark.

So far, the price has been supported by the 28k USD - 27k USD range. If this is the case, remember that trading against the trend may be riskier. It would seem more appropriate to wait for a signal indicating reversal of the trend.

However, considering the current price action and the third rejection from this area, a run to the 29k USD support level and the 50-day moving average seems more likely. A bullish breakout from these levels would initiate a rally towards the 29k USD - 30k USD supply zone – a key level to which the price's reaction would determine the mid-term trend of the market.

In the very short term, the general bearish sentiment is confirmed by technical indicators. Nevertheless, a small upwards rebound in the very short term could occur in case of excessive bearish movements.

After finding bids reach to 29k USD, bitcoin price recovered above 26k USD, 27k USD and 28k USD. Initial Bitcoin resistance lies near the 28,626 USD level (78% of Fibonacci retracement levels).

A decent breakout and follow-up move above 28,626 USD could open the gate for a push towards the 29k USD level. The main resistance remains near the area of 29k USD - 30k USD.

Also it should be noted that Bitcoin and cryptocurrencies unite as the bears lose their momentum. The market is indicating a bullish opportunity above the above-mentioned support levels, for that the bullish outlook remains the same as long as the 100 EMA is headed to the upside.

Trading BTC/USD :

An uptrend will start as soon, as the market rises above resistance level 28k USD, which will be followed by moving up to resistance level 29k USD. Further close above the high end may cause a rally towards 30k USD. Nonetheless, the weekly resistance level and zone should be considered.

Chọn khung thời gian
5
phút
15
phút
30
phút
1
giờ
4
ngày
1
ngày
1
tuần
Kiếm lợi nhuận từ những biến đổi giá của tiền điện tử với InstaForex.
Tải MetaTrader 4 và mở giao dịch đầu tiên của bạn.
  • Grand Choice
    Contest by
    InstaForex
    InstaForex always strives to help you
    fulfill your biggest dreams.
    THAM GIA CUỘC THI

Các bài báo được đề xuất

EUR/USD. Ngày 3 tháng 7. Ngày quan trọng nhất trong tuần

Vào thứ Tư, cặp EUR/USD đã phục hồi từ mức 1.1802, đảo chiều có lợi cho đồng đô la Mỹ, và cho thấy sự suy giảm nhẹ. Tuy nhiên

Samir Klishi 12:10 2025-07-03 UTC+2

GBP/USD: Đồng bảng Anh có thể ngừng nhận được sự hỗ trợ

Như đã đề cập nhiều lần trước đây, sức mạnh của các đồng tiền chính được giao dịch so với đồng đô la Mỹ trên thị trường ngoại hối (Forex)

Pati Gani 11:27 2025-07-03 UTC+2

Dự báo Forex 03/07/2025: EUR/USD, USD/JPY, GBP/USD, SP500, Vàng và Bitcoin

Liên kết hữu ích: Các bài viết khác của tôi có sẵn trong phần này Khóa học InstaForex cho người mới bắt đầu Phân Tích Phổ Biến Mở tài khoản

Sebastian Seliga 10:57 2025-07-03 UTC+2

Dự báo cho GBP/USD vào ngày 3 tháng 7 năm 2025

Trên biểu đồ giờ, cặp GBP/USD vào thứ Tư đã bật lên từ mức thoái lui 200.0% tại 1.3749, đảo chiều có lợi cho đồng đô la Mỹ và giảm

Samir Klishi 10:03 2025-07-03 UTC+2

Nếu dầu thô có khả năng phá vỡ dưới mức Pivot, nó có tiềm năng thử nghiệm mức Hỗ trợ gần nhất của nó, thứ Năm, 03 tháng 7, năm 2025.

Dầu thô, Thứ Năm, 03/07/2025. Điều kiện kinh tế toàn cầu kém, chẳng hạn như sự đình trệ của sản xuất ở Trung Quốc & Châu

Arief Makmur 07:36 2025-07-03 UTC+2

Chỉ số Nasdaq 100 có khả năng kiểm tra mức Kháng cự gần nhất vào thứ Năm, ngày 03 tháng 07, năm 2025.

Chỉ số Nasdaq 100, Thứ Năm, ngày 03 tháng 7 năm 2025. Các báo cáo tài chính tích cực từ Big Tech Company và những tin đồn ngày càng mạnh

Arief Makmur 07:36 2025-07-03 UTC+2

Dự báo EUR/AUD cho ngày 3 tháng 7 năm 2025

Trên biểu đồ hàng ngày, cặp EUR/AUD đang đi ngang ở nửa trên của kênh giá và nằm phía trên đường chỉ báo MACD. Đường tín hiệu của dao động

Laurie Bailey 06:33 2025-07-03 UTC+2

Dự báo EUR/USD cho ngày 3 tháng 7, 2025

Trước khi dữ liệu về việc làm của Mỹ cho tháng 6 được công bố hôm nay, đồng euro đã củng cố gần đường kênh giá trên biểu đồ hàng

Laurie Bailey 05:11 2025-07-03 UTC+2

Dự báo GBP/USD cho ngày 3 tháng 7, 2025

Đến cuối ngày hôm qua, đồng bảng Anh đã mất 108 pips. Mặc dù lý do không phải là do kỳ vọng vào dữ liệu việc

Laurie Bailey 05:11 2025-07-03 UTC+2

Dự báo giá bạc cho ngày 3 tháng 7 năm 2025

Sau hai ngày đấu tranh căng thẳng (thứ Hai và thứ Ba) giữa phe mua và phe bán dọc theo đường kênh giá trong bối cảnh biến động gia tăng

Laurie Bailey 05:11 2025-07-03 UTC+2
Không thể nói chuyện ngay bây giờ?
Đặt câu hỏi của bạn trong phần trò chuyện.
Widget callback
 

Dear visitor,

Your IP address shows that you are currently located in the USA. If you are a resident of the United States, you are prohibited from using the services of InstaFintech Group including online trading, online transfers, deposit/withdrawal of funds, etc.

If you think you are seeing this message by mistake and your location is not the US, kindly proceed to the website. Otherwise, you must leave the website in order to comply with government restrictions.

Why does your IP address show your location as the USA?

  • - you are using a VPN provided by a hosting company based in the United States;
  • - your IP does not have proper WHOIS records;
  • - an error occurred in the WHOIS geolocation database.

Please confirm whether you are a US resident or not by clicking the relevant button below. If you choose the wrong option, being a US resident, you will not be able to open an account with InstaForex anyway.

We are sorry for any inconvenience caused by this message.